Varied parameter
Investment return (expected)
3% → 7%
Software engineer in Cluj-Napoca · A volatile financial ride
This page compares financial outcomes for a Software engineer living in Cluj-Napoca, Romania, following the A volatile financial ride life scenario.
A highly unstable financial path combining income uncertainty, market swings, and repeated adverse events. Outcomes range widely, from recovery and growth to prolonged stagnation.
Cluj-Napoca combines strong tech opportunities with a high quality of life.
The comparison focuses on how changing the Investment return (expected) influences long-term results, while all other assumptions remain constant.
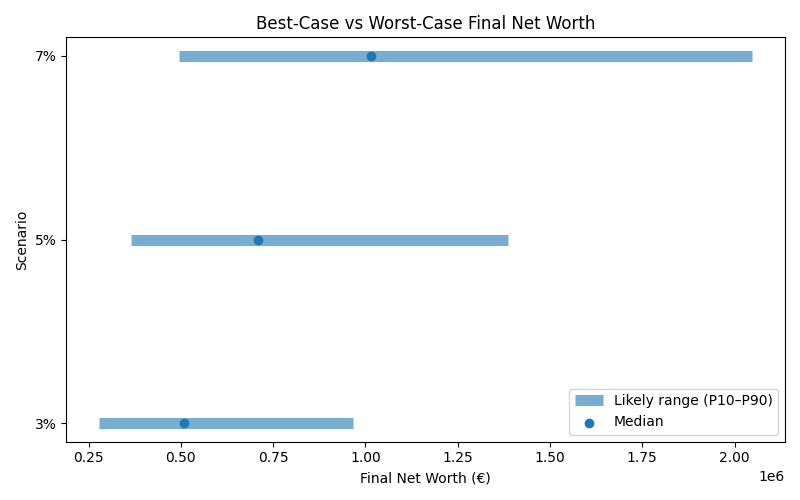
Results are shown as a realistic range. P10 represents a pessimistic outcome, while P90 represents an optimistic outcome. Most simulations fall between these two values.
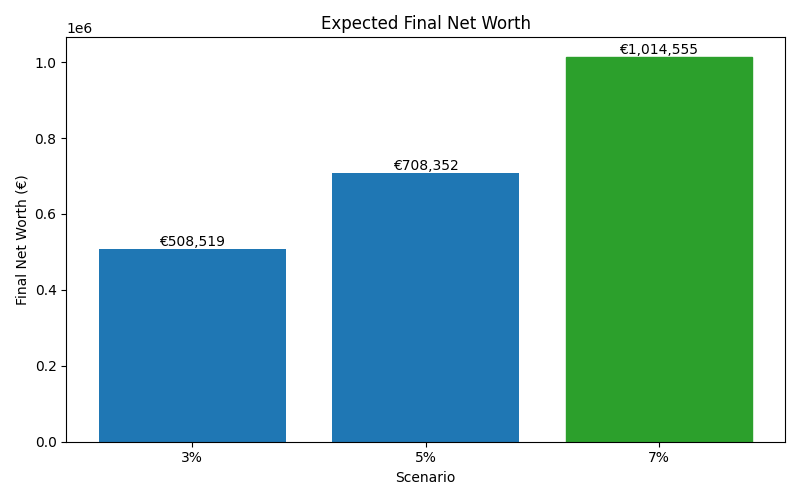
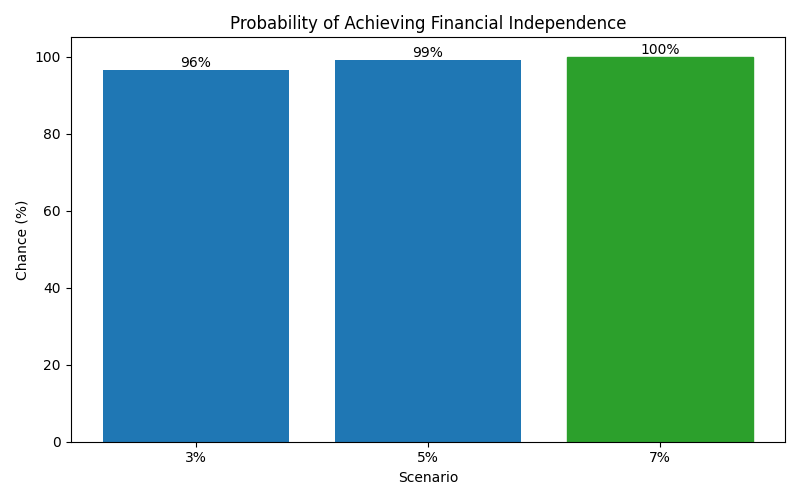
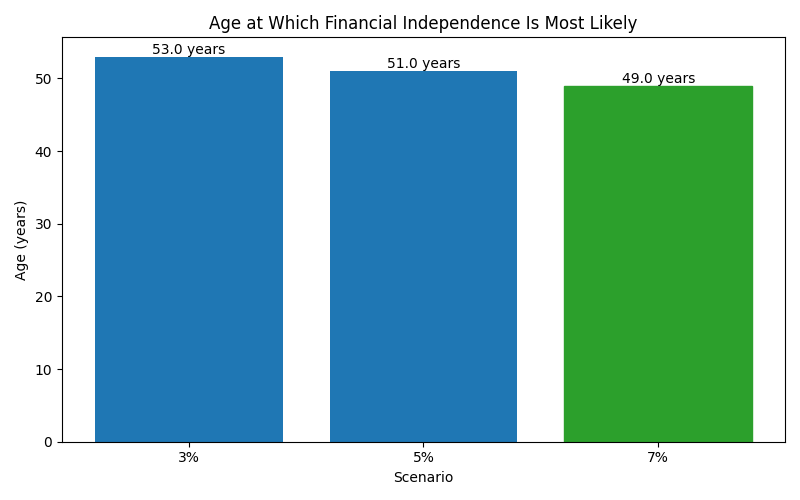
| Scenario | Median Net Worth | P10 Net Worth | P90 Net Worth | FI Probability | FI Median Age |
|---|---|---|---|---|---|
| 3% | 508,519 | 277,915 | 966,268 | 96% | 53 |
| 5% | 708,352 | 365,987 | 1,387,449 | 99% | 51 |
| 7% | 1,014,555 | 494,856 | 2,048,114 | 100% | 49 |
These charts show how each scenario affects long-term outcomes, including expected wealth, downside risk, and the likelihood of achieving financial independence.