Varied parameter
Income tax rate
0% → 30%
Software engineer in Cluj-Napoca · A volatile financial ride
This page compares financial outcomes for a Software engineer living in Cluj-Napoca, Romania, following the A volatile financial ride life scenario.
A highly unstable financial path combining income uncertainty, market swings, and repeated adverse events. Outcomes range widely, from recovery and growth to prolonged stagnation.
Cluj-Napoca combines strong tech opportunities with a high quality of life.
The comparison focuses on how changing the Income tax rate influences long-term results, while all other assumptions remain constant.
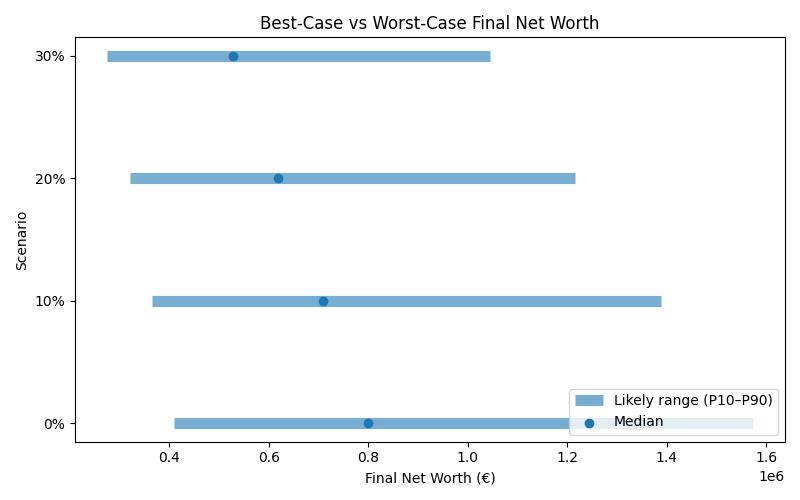
Results are shown as a realistic range. P10 represents a pessimistic outcome, while P90 represents an optimistic outcome. Most simulations fall between these two values.
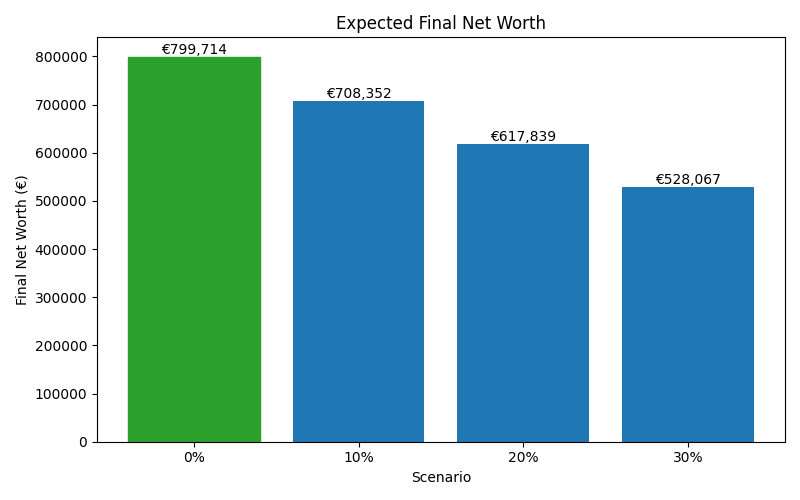
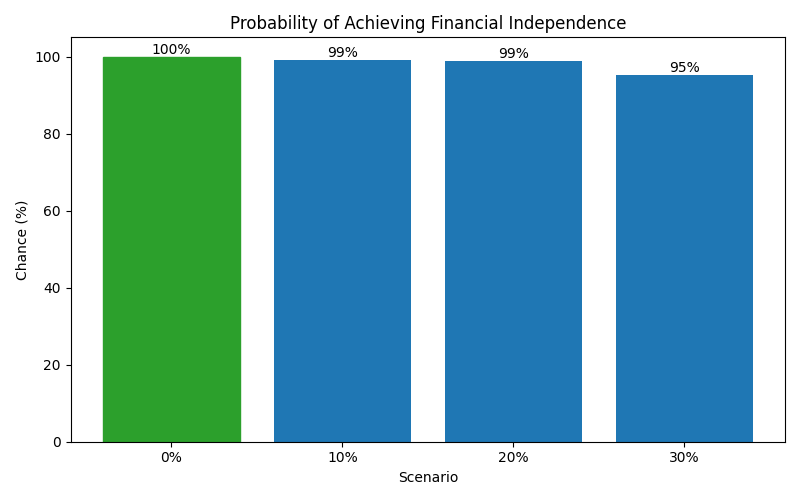
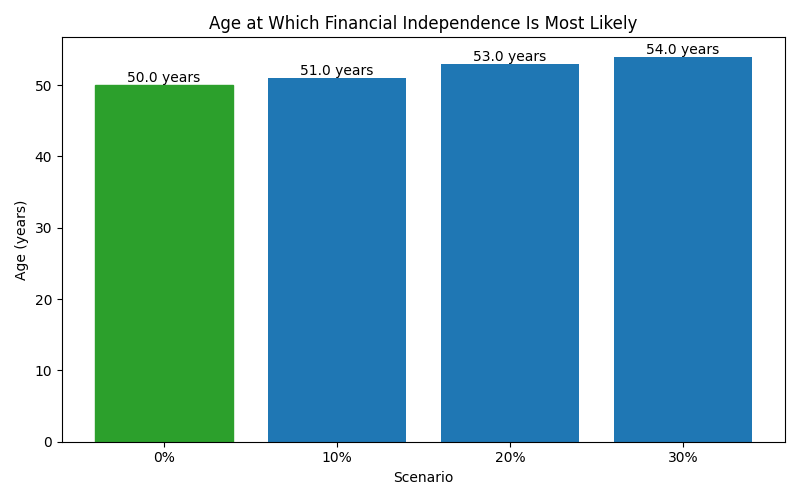
| Scenario | Median Net Worth | P10 Net Worth | P90 Net Worth | FI Probability | FI Median Age |
|---|---|---|---|---|---|
| 0% | 799,714.17 | 410,372.834 | 1,572,336.781 | 100% | 50 |
| 10% | 708,351.8400000001 | 365,987.066 | 1,387,448.588 | 99% | 51 |
| 20% | 617,839.215 | 321,156.923 | 1,215,744.788 | 98% | 53 |
| 30% | 528,066.56 | 275,813.29000000004 | 1,045,250.6950000001 | 95% | 54 |
These charts show how each scenario affects long-term outcomes, including expected wealth, downside risk, and the likelihood of achieving financial independence.