Varied parameter
Saving rate
5% → 25%
Software engineer in Cluj-Napoca · A volatile financial ride
This page compares financial outcomes for a Software engineer living in Cluj-Napoca, Romania, following the A volatile financial ride life scenario.
A highly unstable financial path combining income uncertainty, market swings, and repeated adverse events. Outcomes range widely, from recovery and growth to prolonged stagnation.
Cluj-Napoca combines strong tech opportunities with a high quality of life.
The comparison focuses on how changing the Saving rate influences long-term results, while all other assumptions remain constant.
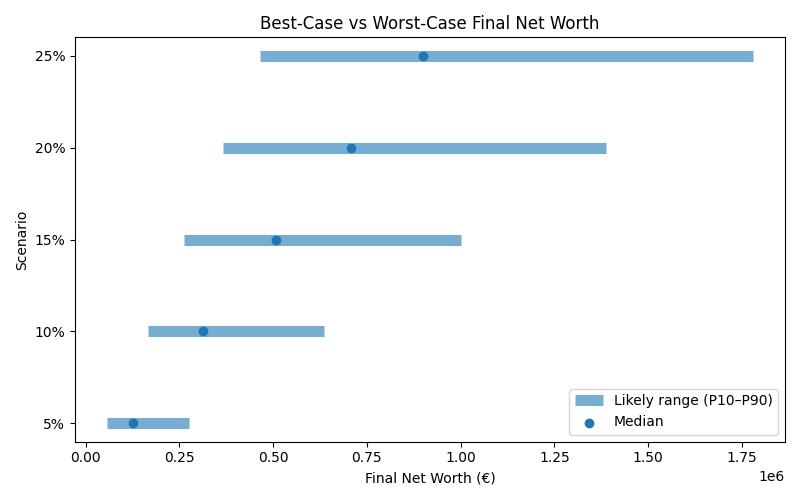
Results are shown as a realistic range. P10 represents a pessimistic outcome, while P90 represents an optimistic outcome. Most simulations fall between these two values.
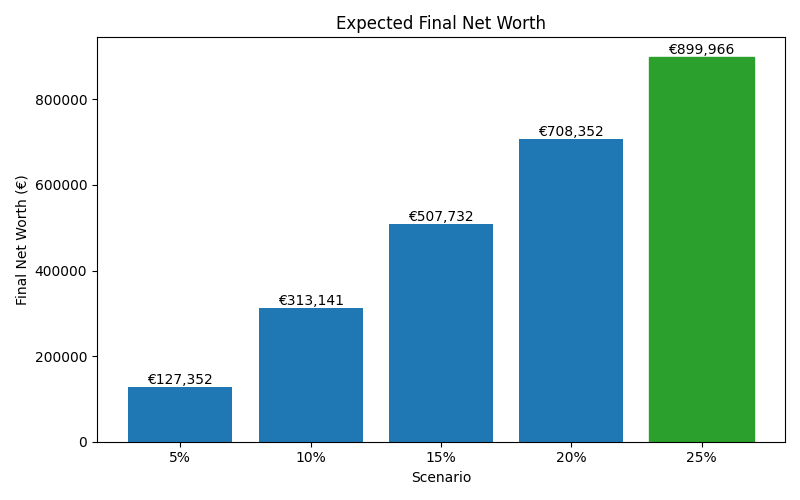
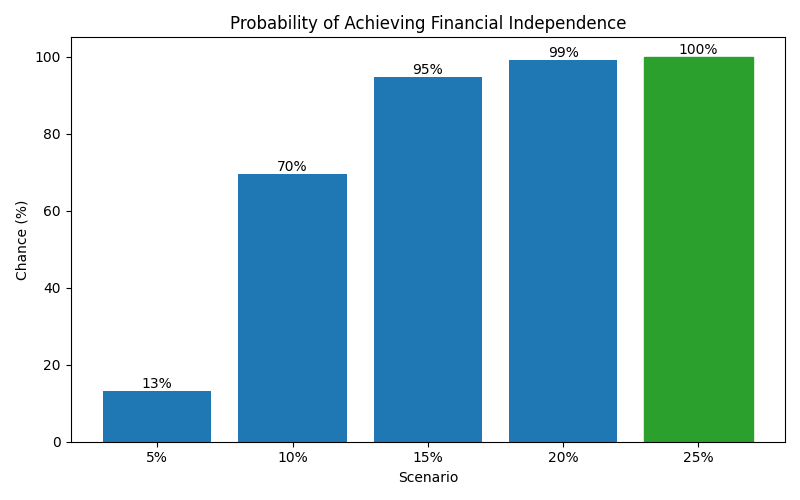
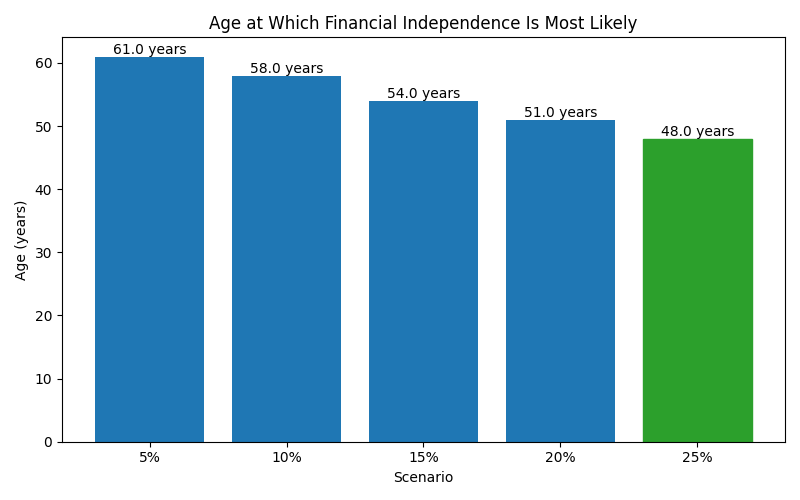
| Scenario | Median Net Worth | P10 Net Worth | P90 Net Worth | FI Probability | FI Median Age |
|---|---|---|---|---|---|
| 5% | 127,351.535 | 58,036.918000000005 | 275,347.07200000004 | 13% | 61 |
| 10% | 313,141.05000000005 | 166,170.315 | 636,645.715 | 69% | 58 |
| 15% | 507,732.265 | 263,707.643 | 1,001,602.3310000001 | 94% | 54 |
| 20% | 708,351.8400000001 | 365,987.066 | 1,387,448.588 | 99% | 51 |
| 25% | 899,965.575 | 466,218.331 | 1,778,464.4610000001 | 100% | 48 |
These charts show how each scenario affects long-term outcomes, including expected wealth, downside risk, and the likelihood of achieving financial independence.