Varied parameter
Income tax rate
0% → 30%
Software engineer in Cluj-Napoca · The steady builder
This page compares financial outcomes for a Software engineer living in Cluj-Napoca, Romania, following the The steady builder life scenario.
A balanced financial life built on predictable income growth, consistent saving, and long-term market participation. Progress comes from patience, stability, and compounding over time.
Cluj-Napoca combines strong tech opportunities with a high quality of life.
The comparison focuses on how changing the Income tax rate influences long-term results, while all other assumptions remain constant.
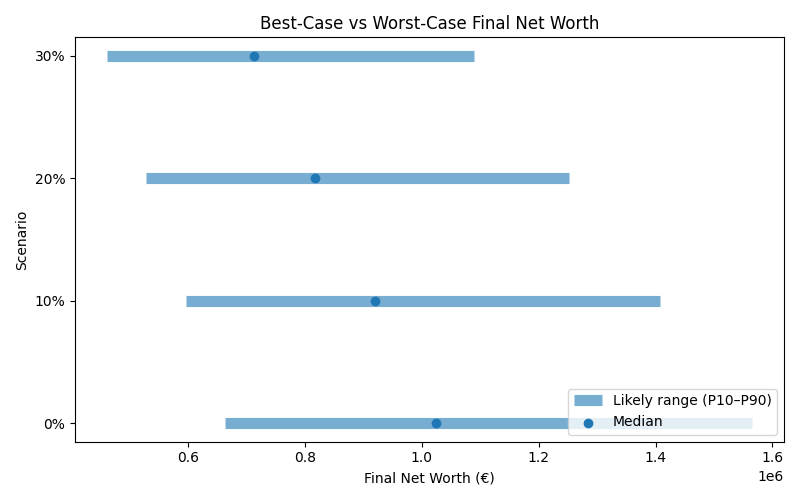
Results are shown as a realistic range. P10 represents a pessimistic outcome, while P90 represents an optimistic outcome. Most simulations fall between these two values.
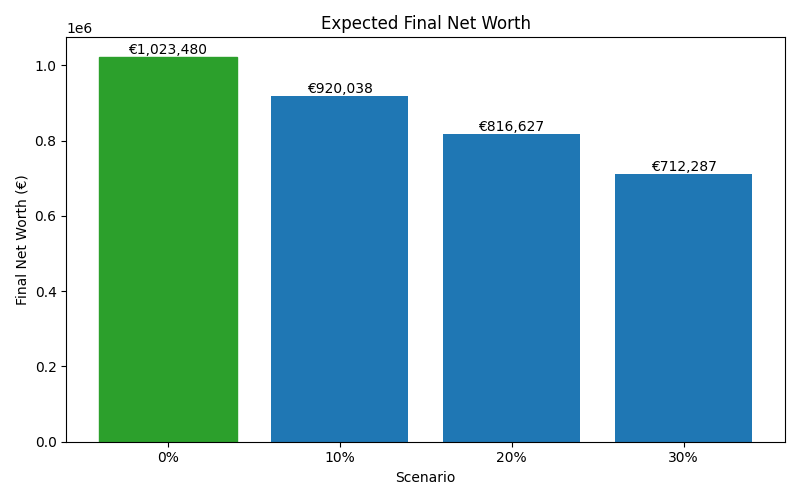
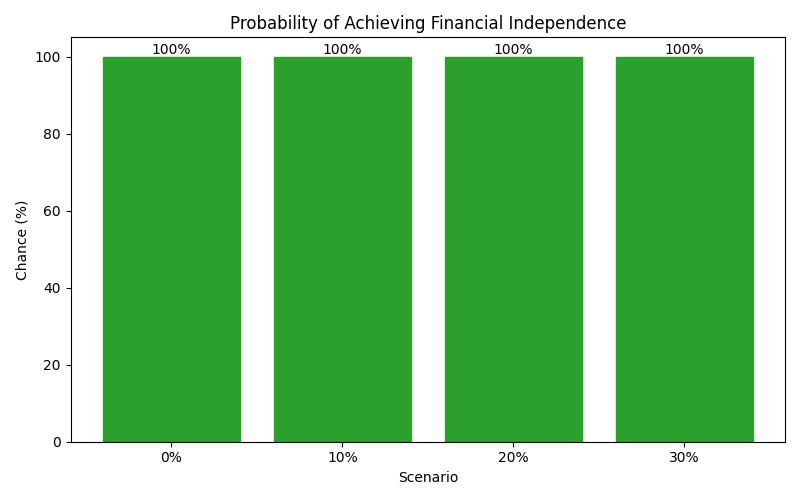
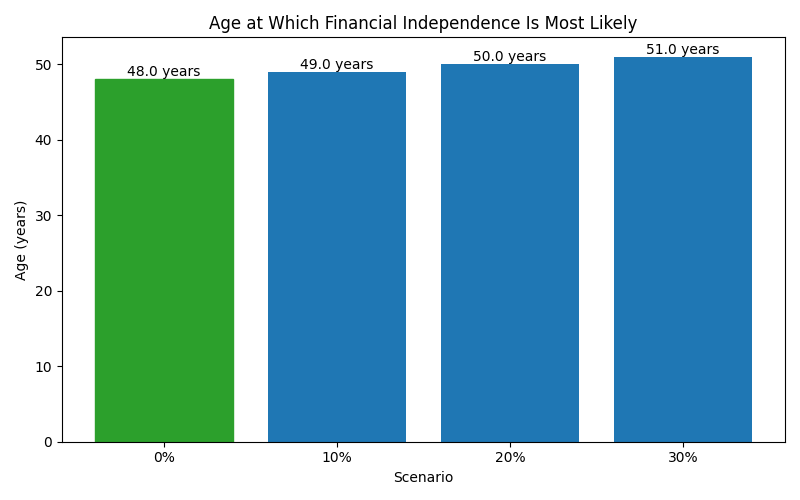
| Scenario | Median Net Worth | P10 Net Worth | P90 Net Worth | FI Probability | FI Median Age |
|---|---|---|---|---|---|
| 0% | 1,023,479.94 | 662,972.224 | 1,564,618.252 | 100% | 48 |
| 10% | 920,037.6000000001 | 595,632.669 | 1,407,895.1469999999 | 100% | 49 |
| 20% | 816,627.06 | 528,368.826 | 1,251,159.8539999998 | 100% | 50 |
| 30% | 712,287.3500000001 | 461,515.82300000003 | 1,089,851.058 | 100% | 51 |
These charts show how each scenario affects long-term outcomes, including expected wealth, downside risk, and the likelihood of achieving financial independence.