Varied parameter
Saving rate
5% → 25%
Software engineer in Cluj-Napoca · The steady builder
This page compares financial outcomes for a Software engineer living in Cluj-Napoca, Romania, following the The steady builder life scenario.
A balanced financial life built on predictable income growth, consistent saving, and long-term market participation. Progress comes from patience, stability, and compounding over time.
Cluj-Napoca combines strong tech opportunities with a high quality of life.
The comparison focuses on how changing the Saving rate influences long-term results, while all other assumptions remain constant.
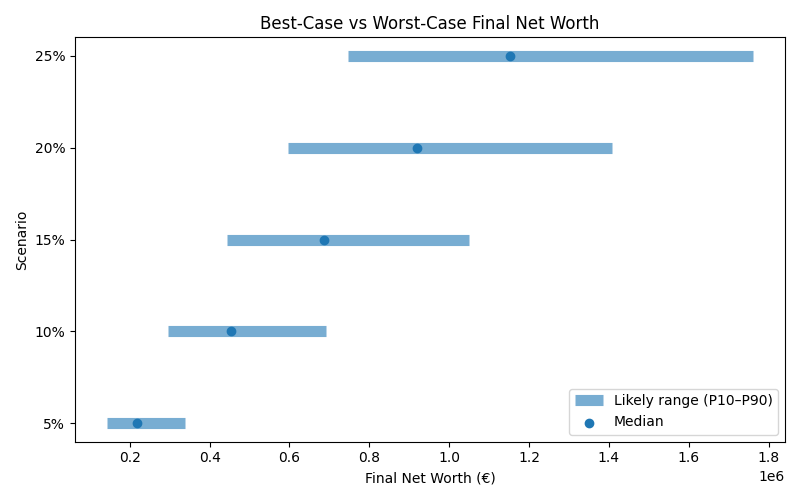
Results are shown as a realistic range. P10 represents a pessimistic outcome, while P90 represents an optimistic outcome. Most simulations fall between these two values.
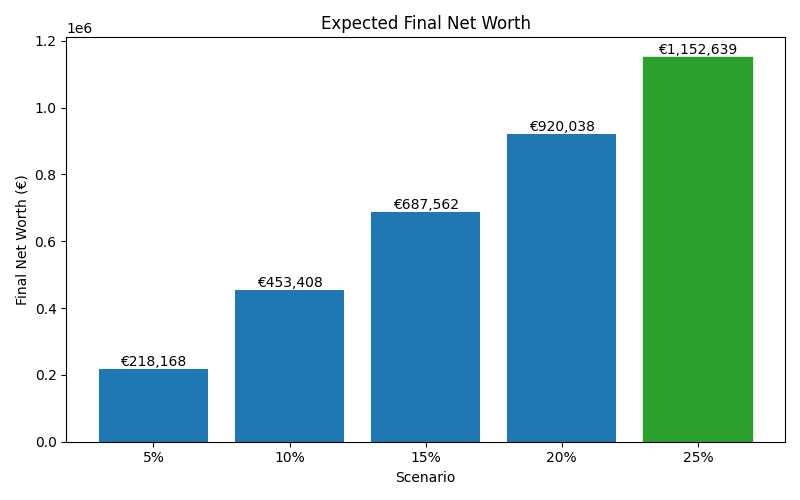
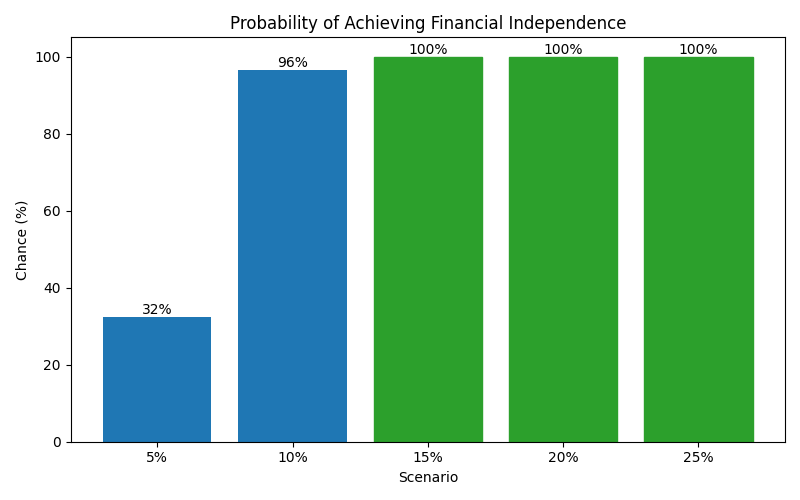
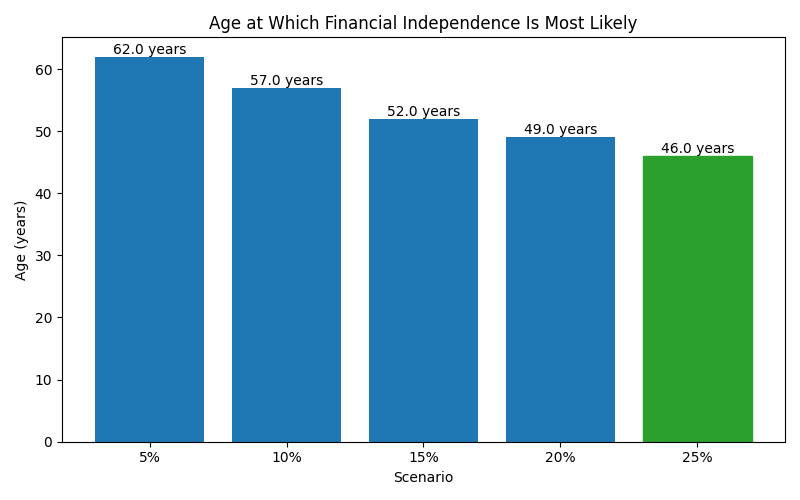
| Scenario | Median Net Worth | P10 Net Worth | P90 Net Worth | FI Probability | FI Median Age |
|---|---|---|---|---|---|
| 5% | 218,167.54499999998 | 143,623.106 | 338,433.407 | 32% | 62 |
| 10% | 453,408.06000000006 | 294,512.005 | 692,311.4240000001 | 96% | 57 |
| 15% | 687,562.075 | 444,501.69299999997 | 1,049,737.308 | 100% | 52 |
| 20% | 920,037.6000000001 | 595,632.669 | 1,407,895.1469999999 | 100% | 49 |
| 25% | 1,152,638.505 | 746,727.5830000001 | 1,760,431.5700000003 | 100% | 46 |
These charts show how each scenario affects long-term outcomes, including expected wealth, downside risk, and the likelihood of achieving financial independence.