Varied parameter
Saving rate
5% → 25%
Software engineer in Cluj-Napoca · Starting late
This page compares financial outcomes for a Software engineer living in Cluj-Napoca, Romania, following the Starting late life scenario.
A financial life that begins later, leaving fewer years for compounding to work. Success relies on disciplined saving, steady income, and sustained focus over a shorter horizon.
Cluj-Napoca combines strong tech opportunities with a high quality of life.
The comparison focuses on how changing the Saving rate influences long-term results, while all other assumptions remain constant.
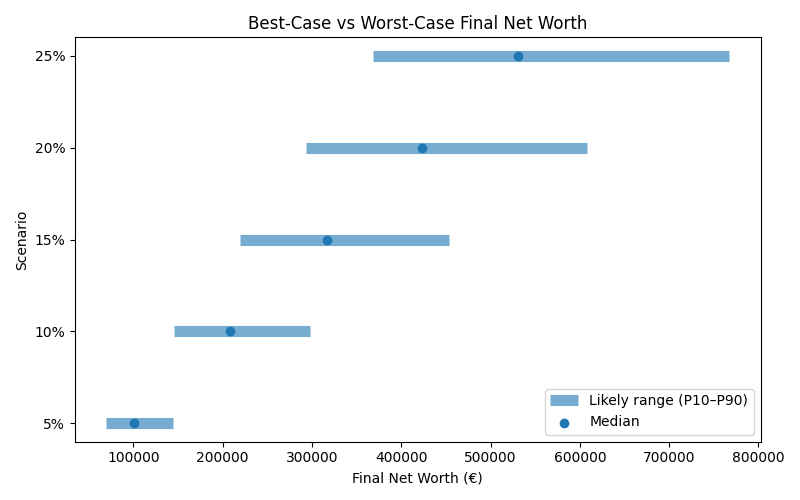
Results are shown as a realistic range. P10 represents a pessimistic outcome, while P90 represents an optimistic outcome. Most simulations fall between these two values.
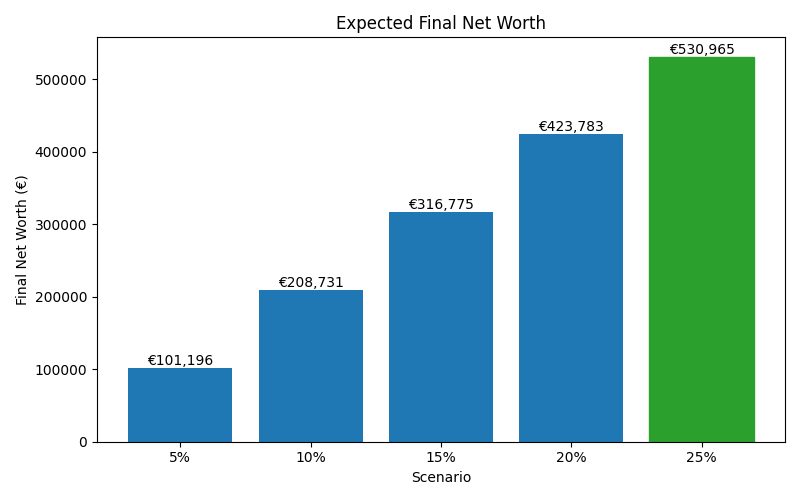
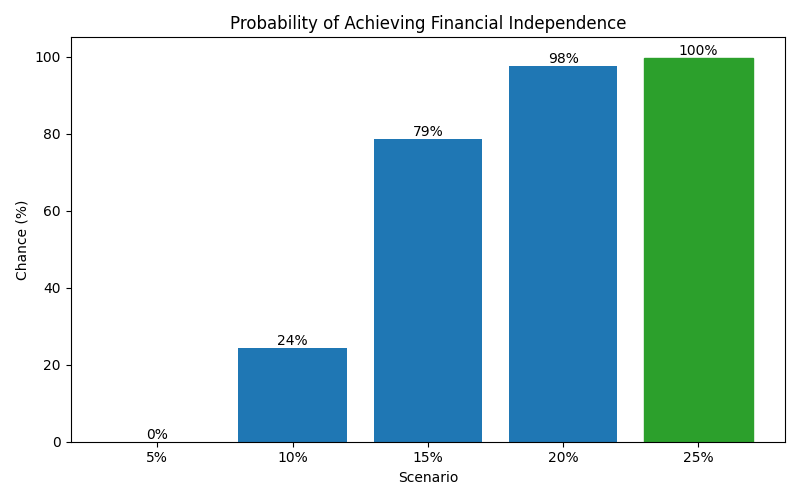
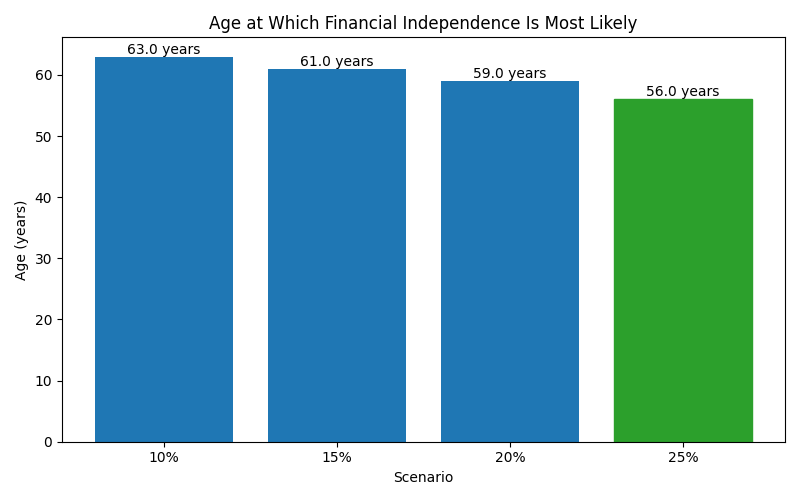
| Scenario | Median Net Worth | P10 Net Worth | P90 Net Worth | FI Probability | FI Median Age |
|---|---|---|---|---|---|
| 5% | 101,196.095 | 69,618.808 | 144,627.512 | 0% | — |
| 10% | 208,730.825 | 145,380.05800000002 | 298,344.68600000005 | 24% | 63 |
| 15% | 316,775.12 | 219,841.066 | 453,413.58 | 78% | 61 |
| 20% | 423,783.135 | 293,883.267 | 608,189.7960000001 | 97% | 59 |
| 25% | 530,965.335 | 368,688.791 | 767,540.501 | 99% | 56 |
These charts show how each scenario affects long-term outcomes, including expected wealth, downside risk, and the likelihood of achieving financial independence.