Varied parameter
Income tax rate
0% → 30%
Software engineer in Cluj-Napoca · Peak earning years
This page compares financial outcomes for a Software engineer living in Cluj-Napoca, Romania, following the Peak earning years life scenario.
A high-income trajectory with strong saving capacity and rapid wealth accumulation. Compounding works faster here, but results remain exposed to market cycles and timing.
Cluj-Napoca combines strong tech opportunities with a high quality of life.
The comparison focuses on how changing the Income tax rate influences long-term results, while all other assumptions remain constant.
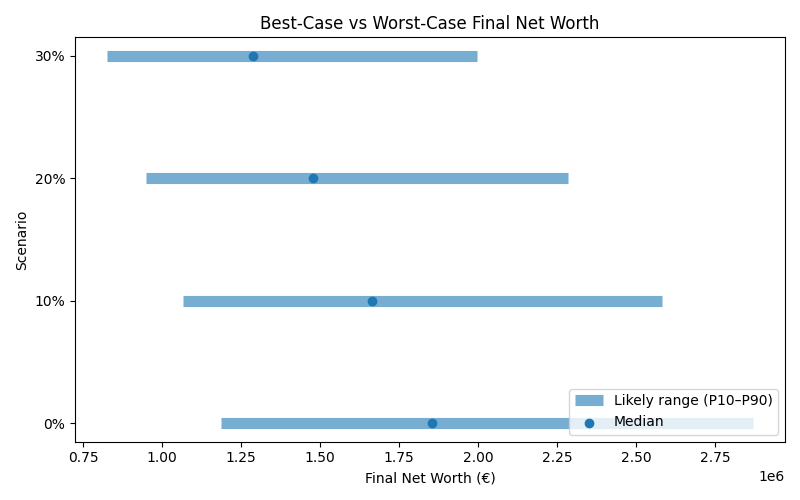
Results are shown as a realistic range. P10 represents a pessimistic outcome, while P90 represents an optimistic outcome. Most simulations fall between these two values.
| Scenario | Median Net Worth | P10 Net Worth | P90 Net Worth | FI Probability | FI Median Age |
|---|---|---|---|---|---|
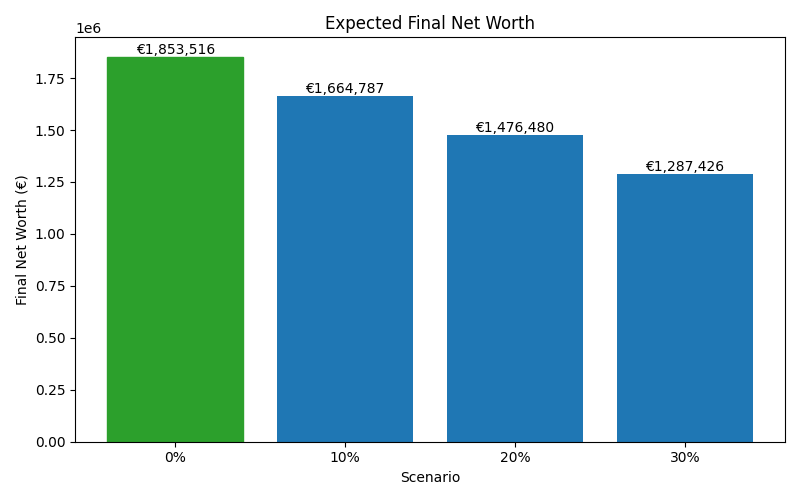
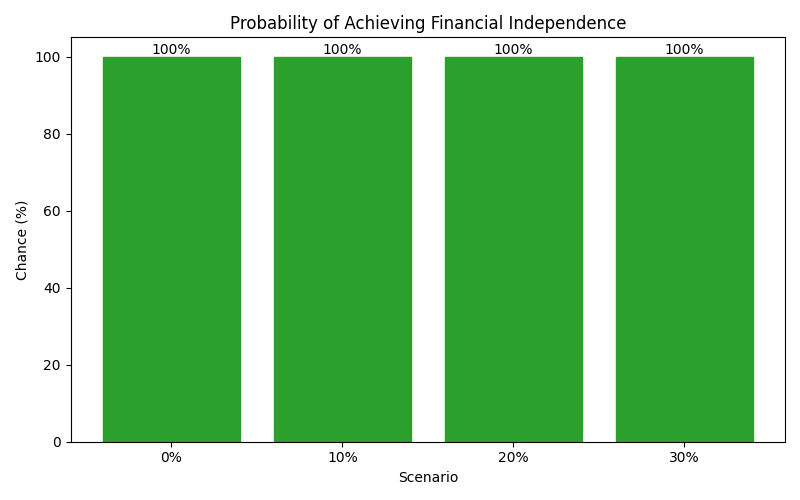
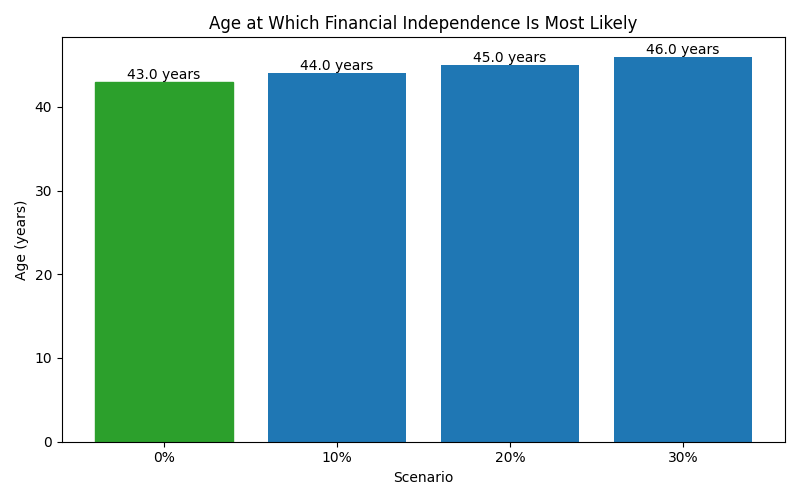
| 0% | 1,853,516 | 1,187,076 | 2,868,532 | 100% | 43 |
| 10% | 1,664,787 | 1,067,587 | 2,580,876 | 100% | 44 |
| 20% | 1,476,480 | 947,980 | 2,285,240 | 100% | 45 |
| 30% | 1,287,426 | 826,615 | 1,994,894 | 100% | 46 |
These charts show how each scenario affects long-term outcomes, including expected wealth, downside risk, and the likelihood of achieving financial independence.