Varied parameter
Income growth (annual)
1% → 5%
Software engineer in Cluj-Napoca · Peak earning years
This page compares financial outcomes for a Software engineer living in Cluj-Napoca, Romania, following the Peak earning years life scenario.
A high-income trajectory with strong saving capacity and rapid wealth accumulation. Compounding works faster here, but results remain exposed to market cycles and timing.
Cluj-Napoca combines strong tech opportunities with a high quality of life.
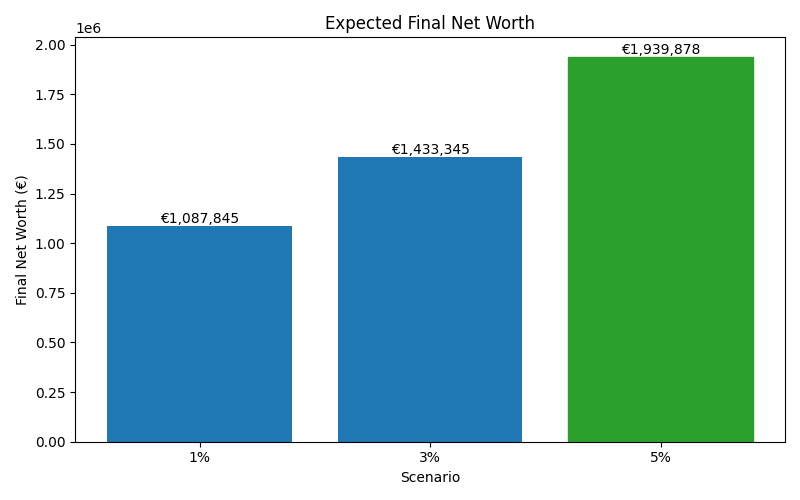
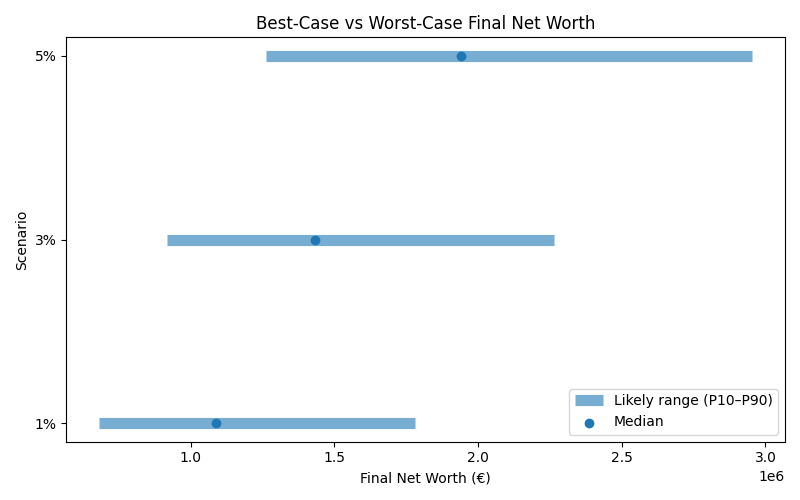
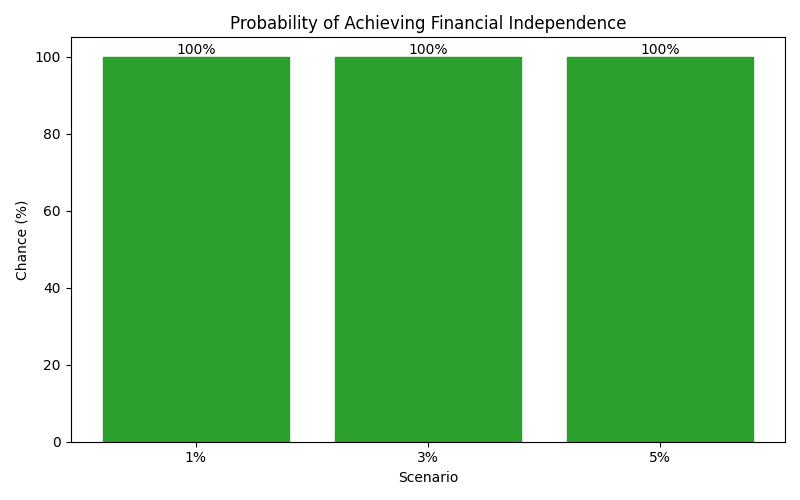
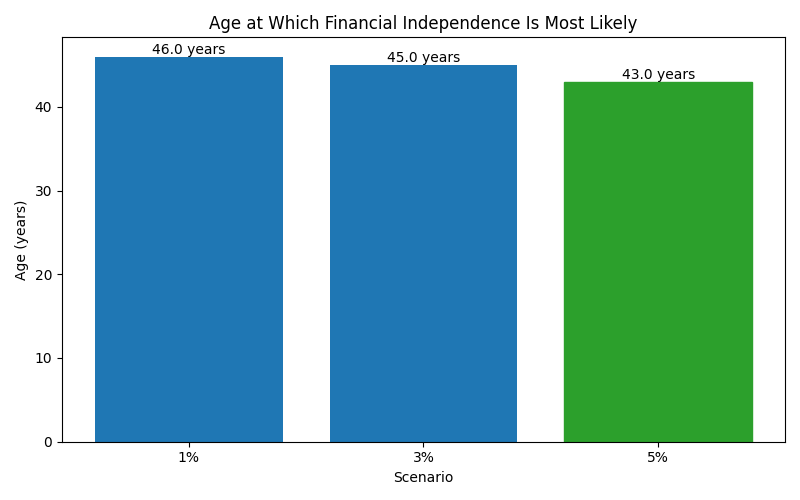
The comparison focuses on how changing the Income growth (annual) influences long-term results, while all other assumptions remain constant.
Results are shown as a realistic range. P10 represents a pessimistic outcome, while P90 represents an optimistic outcome. Most simulations fall between these two values.
| Scenario | Median Net Worth | P10 Net Worth | P90 Net Worth | FI Probability | FI Median Age |
|---|---|---|---|---|---|
| 1% | 1,087,845 | 680,766 | 1,779,982 | 100% | 46 |
| 3% | 1,433,345 | 916,205 | 2,265,238 | 100% | 45 |
| 5% | 1,939,878 | 1,261,485 | 2,954,421 | 100% | 43 |
These charts show how each scenario affects long-term outcomes, including expected wealth, downside risk, and the likelihood of achieving financial independence.