Varied parameter
Saving rate
5% → 25%
Software engineer in Cluj-Napoca · Independent and uneven
This page compares financial outcomes for a Software engineer living in Cluj-Napoca, Romania, following the Independent and uneven life scenario.
A non-linear income path shaped by project-based work, variability, and self-managed risk. Flexibility is high, but consistency must be actively created rather than assumed.
Cluj-Napoca combines strong tech opportunities with a high quality of life.
The comparison focuses on how changing the Saving rate influences long-term results, while all other assumptions remain constant.
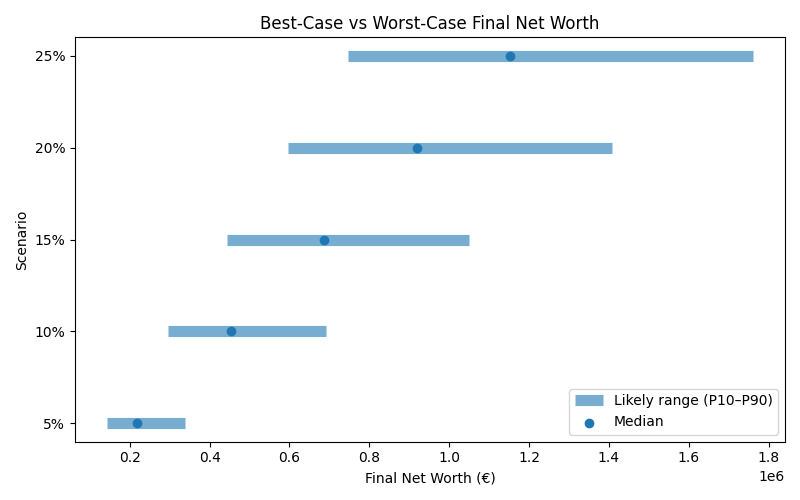
Results are shown as a realistic range. P10 represents a pessimistic outcome, while P90 represents an optimistic outcome. Most simulations fall between these two values.
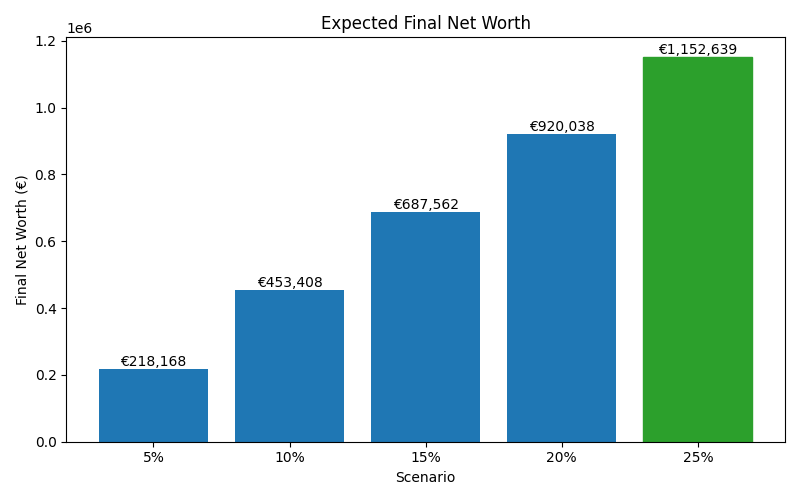
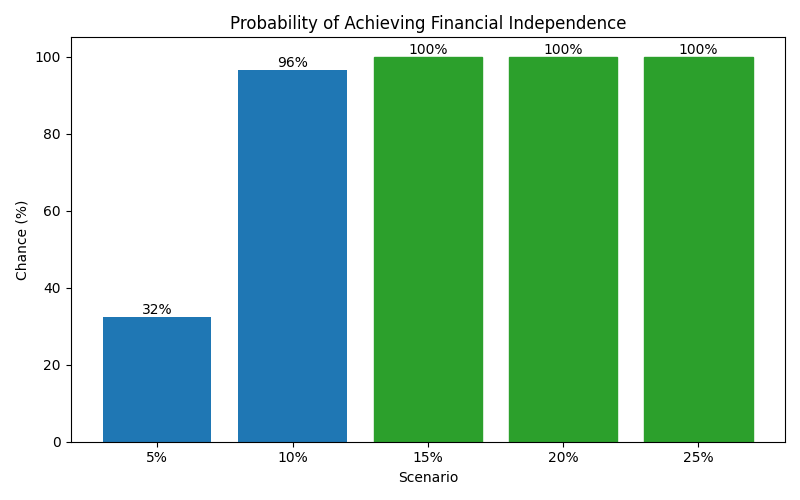
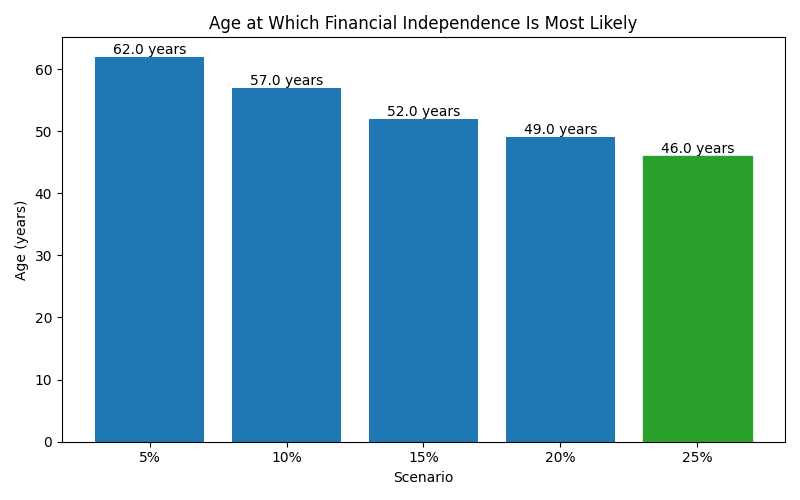
| Scenario | Median Net Worth | P10 Net Worth | P90 Net Worth | FI Probability | FI Median Age |
|---|---|---|---|---|---|
| 5% | 218,168 | 143,623 | 338,433 | 32% | 62 |
| 10% | 453,408 | 294,512 | 692,311 | 96% | 57 |
| 15% | 687,562 | 444,502 | 1,049,737 | 100% | 52 |
| 20% | 920,038 | 595,633 | 1,407,895 | 100% | 49 |
| 25% | 1,152,639 | 746,728 | 1,760,432 | 100% | 46 |
These charts show how each scenario affects long-term outcomes, including expected wealth, downside risk, and the likelihood of achieving financial independence.