Varied parameter
Saving rate
5% → 25%
Software engineer in Cluj-Napoca · Fast-track independence
This page compares financial outcomes for a Software engineer living in Cluj-Napoca, Romania, following the Fast-track independence life scenario.
A high-intensity saving and investing strategy aimed at reaching financial independence as early as possible. Strong outcomes require discipline, sacrifice, and tolerance for market risk.
Cluj-Napoca combines strong tech opportunities with a high quality of life.
The comparison focuses on how changing the Saving rate influences long-term results, while all other assumptions remain constant.
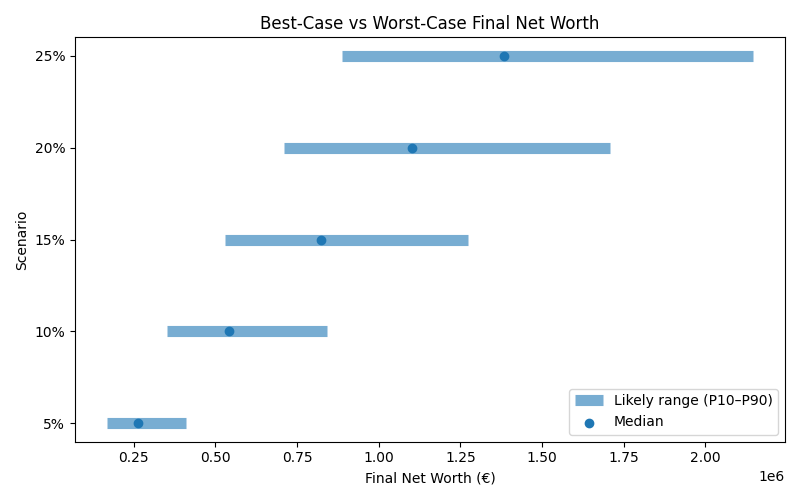
Results are shown as a realistic range. P10 represents a pessimistic outcome, while P90 represents an optimistic outcome. Most simulations fall between these two values.
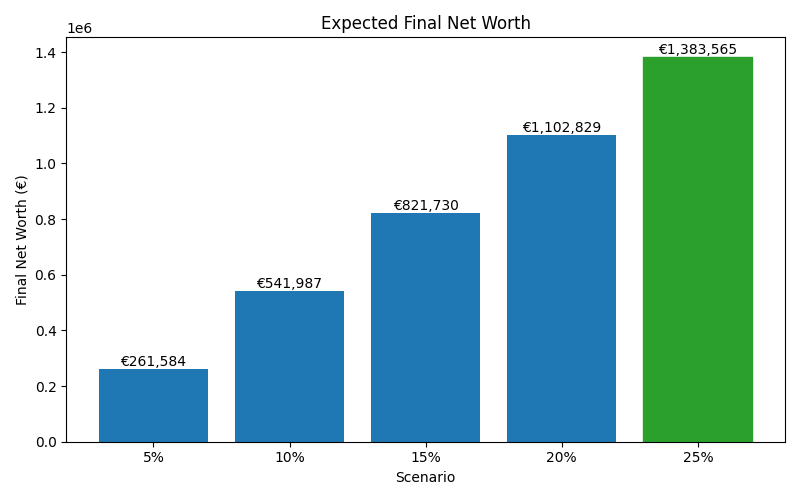
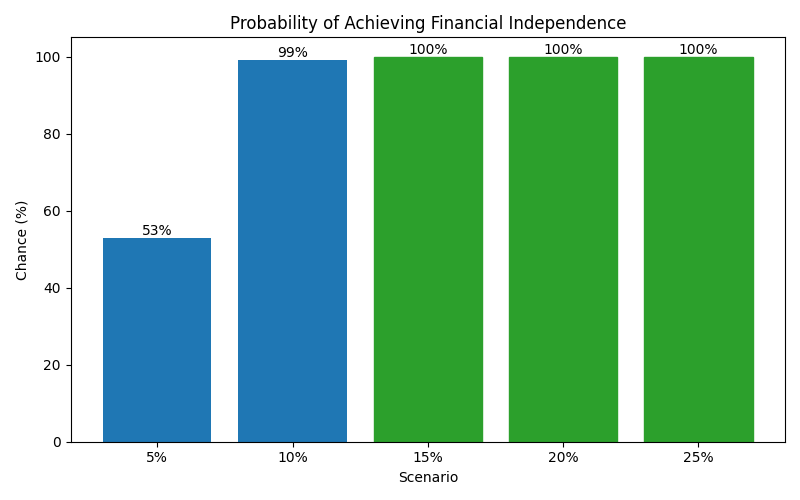
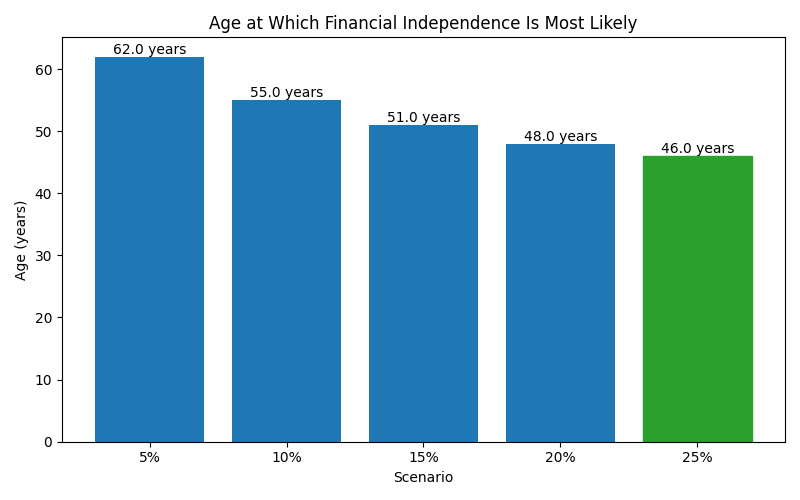
| Scenario | Median Net Worth | P10 Net Worth | P90 Net Worth | FI Probability | FI Median Age |
|---|---|---|---|---|---|
| 5% | 261,584.49 | 168,910.45 | 409,937.821 | 52% | 62 |
| 10% | 541,986.8300000001 | 350,410.421 | 840,694.3940000001 | 99% | 55 |
| 15% | 821,729.9550000001 | 528,816.062 | 1,273,537.9009999998 | 100% | 51 |
| 20% | 1,102,829.4 | 709,397.033 | 1,709,491.678 | 100% | 48 |
| 25% | 1,383,564.795 | 888,354.563 | 2,144,974.8389999997 | 100% | 46 |
These charts show how each scenario affects long-term outcomes, including expected wealth, downside risk, and the likelihood of achieving financial independence.