Varied parameter
Income tax rate
0% → 30%
Software engineer in Madrid · Starting late
This page compares financial outcomes for a Software engineer living in Madrid, Spain, following the Starting late life scenario.
A financial life that begins later, leaving fewer years for compounding to work. Success relies on disciplined saving, steady income, and sustained focus over a shorter horizon.
Madrid concentrates many higher-paying roles and business opportunities, with a correspondingly higher urban cost structure.
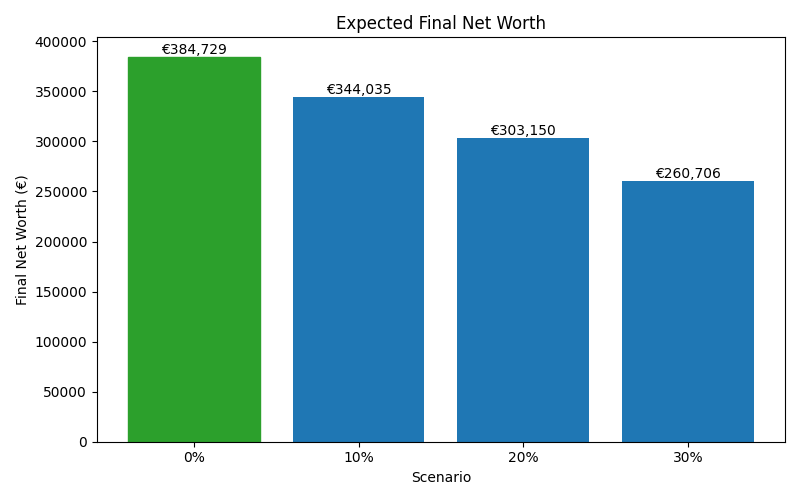
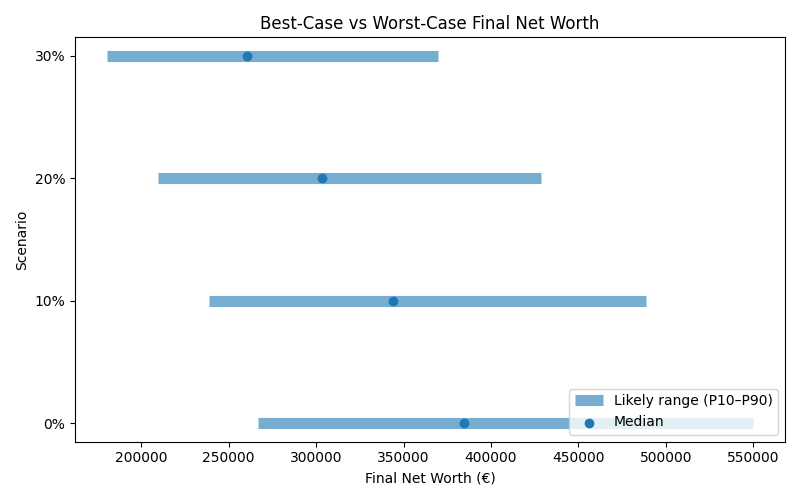
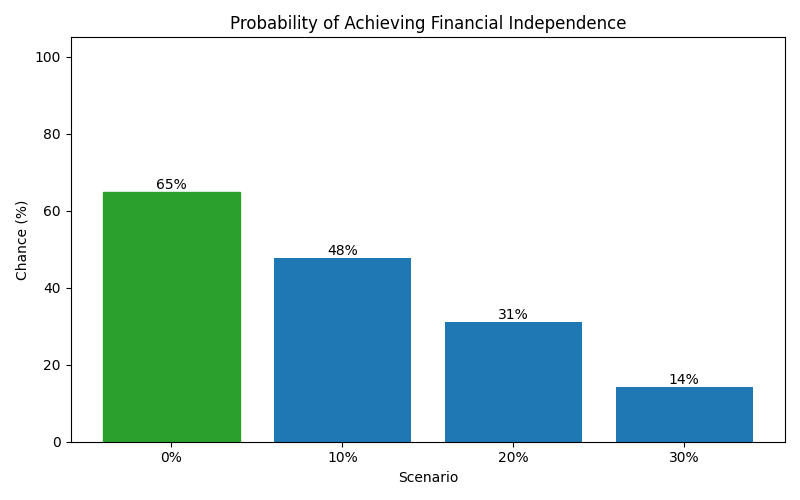
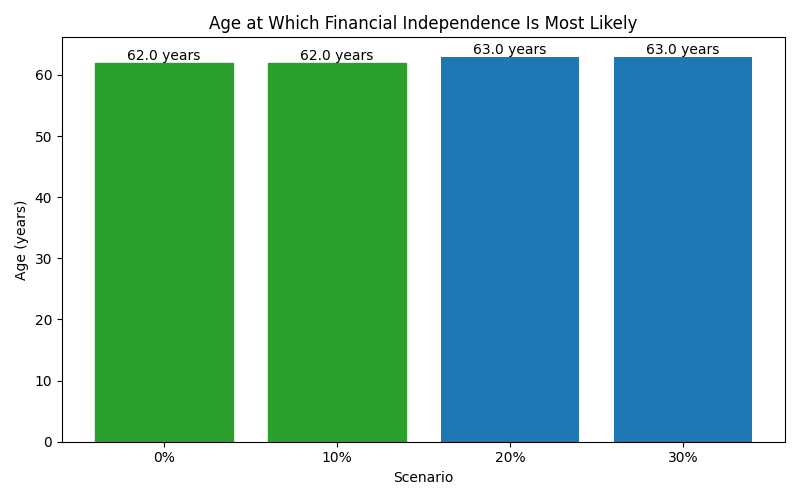
The comparison focuses on how changing the Income tax rate influences long-term results, while all other assumptions remain constant.
Results are shown as a realistic range. P10 represents a pessimistic outcome, while P90 represents an optimistic outcome. Most simulations fall between these two values.
| Scenario | Median Net Worth | P10 Net Worth | P90 Net Worth | FI Probability | FI Median Age |
|---|---|---|---|---|---|
| 0% | 384,729 | 266,737 | 549,605 | 65% | 62 |
| 10% | 344,035 | 238,764 | 488,542 | 48% | 62 |
| 20% | 303,150 | 209,910 | 428,484 | 31% | 63 |
| 30% | 260,706 | 180,642 | 369,903 | 14% | 63 |
These charts show how each scenario affects long-term outcomes, including expected wealth, downside risk, and the likelihood of achieving financial independence.