Varied parameter
Investment return (expected)
3% → 7%
Software engineer in Madrid · Independent and uneven
This page compares financial outcomes for a Software engineer living in Madrid, Spain, following the Independent and uneven life scenario.
A non-linear income path shaped by project-based work, variability, and self-managed risk. Flexibility is high, but consistency must be actively created rather than assumed.
Madrid concentrates many higher-paying roles and business opportunities, with a correspondingly higher urban cost structure.
The comparison focuses on how changing the Investment return (expected) influences long-term results, while all other assumptions remain constant.
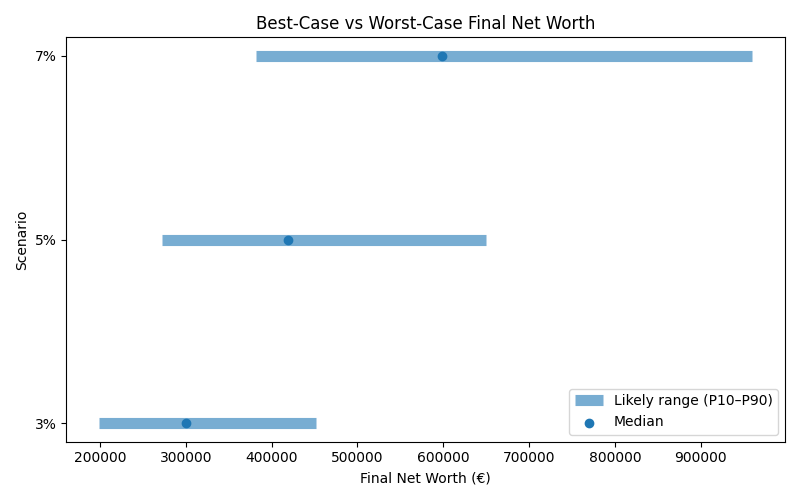
Results are shown as a realistic range. P10 represents a pessimistic outcome, while P90 represents an optimistic outcome. Most simulations fall between these two values.
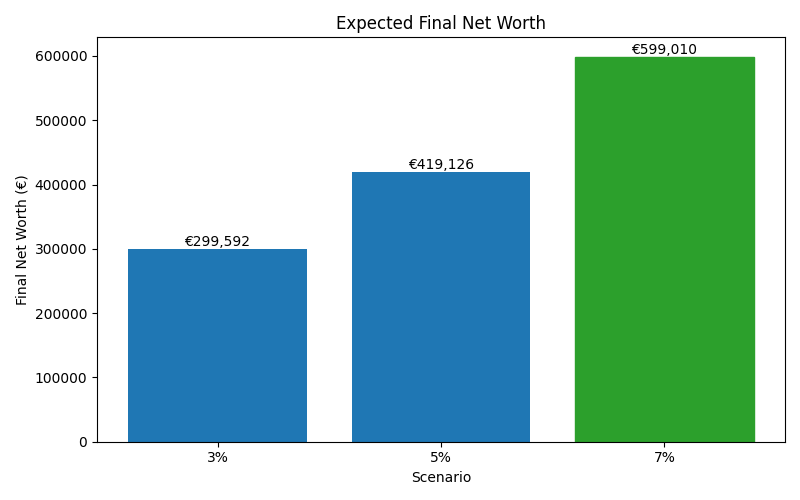
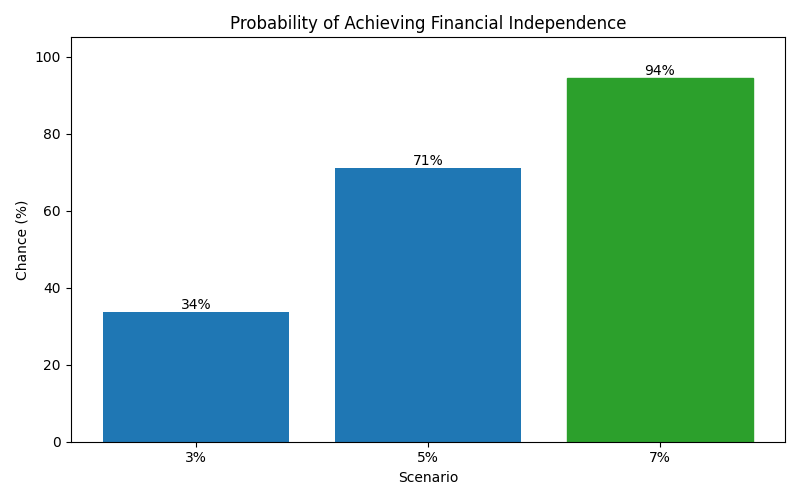
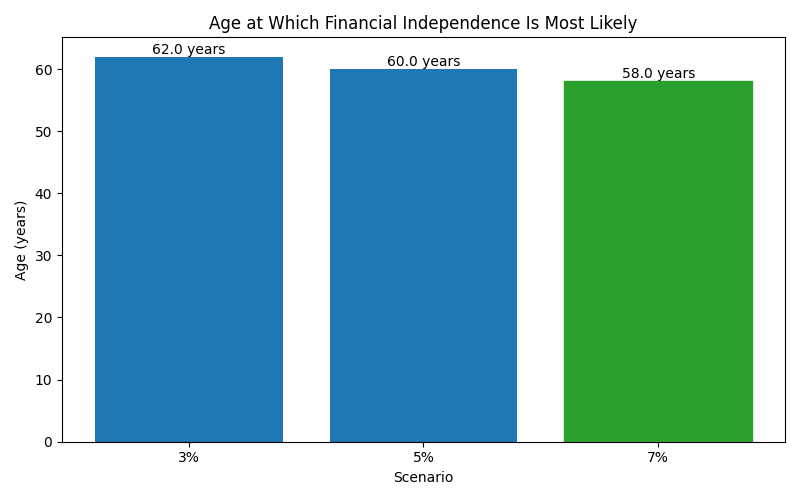
| Scenario | Median Net Worth | P10 Net Worth | P90 Net Worth | FI Probability | FI Median Age |
|---|---|---|---|---|---|
| 3% | 299,592 | 198,535 | 451,918 | 34% | 62 |
| 5% | 419,126 | 271,694 | 649,644 | 71% | 60 |
| 7% | 599,010 | 382,163 | 960,278 | 94% | 58 |
These charts show how each scenario affects long-term outcomes, including expected wealth, downside risk, and the likelihood of achieving financial independence.