Varied parameter
Income tax rate
0% → 30%
Software engineer in Madrid · Independent and uneven
This page compares financial outcomes for a Software engineer living in Madrid, Spain, following the Independent and uneven life scenario.
A non-linear income path shaped by project-based work, variability, and self-managed risk. Flexibility is high, but consistency must be actively created rather than assumed.
Madrid concentrates many higher-paying roles and business opportunities, with a correspondingly higher urban cost structure.
The comparison focuses on how changing the Income tax rate influences long-term results, while all other assumptions remain constant.
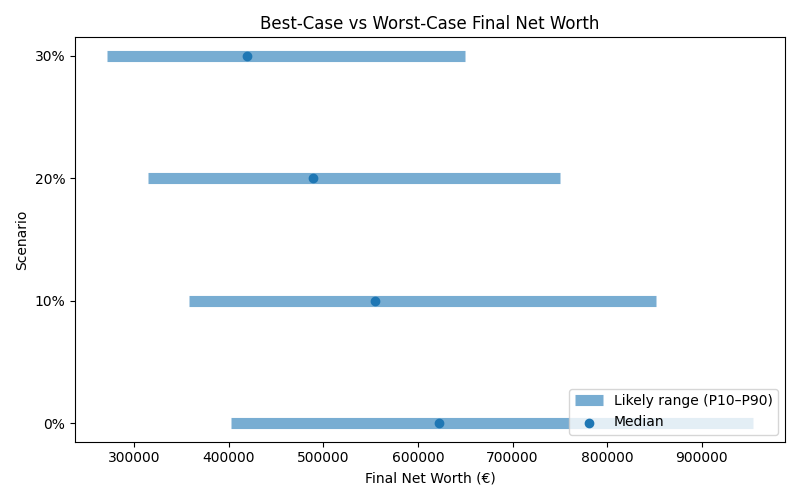
Results are shown as a realistic range. P10 represents a pessimistic outcome, while P90 represents an optimistic outcome. Most simulations fall between these two values.
| Scenario | Median Net Worth | P10 Net Worth | P90 Net Worth | FI Probability | FI Median Age |
|---|---|---|---|---|---|
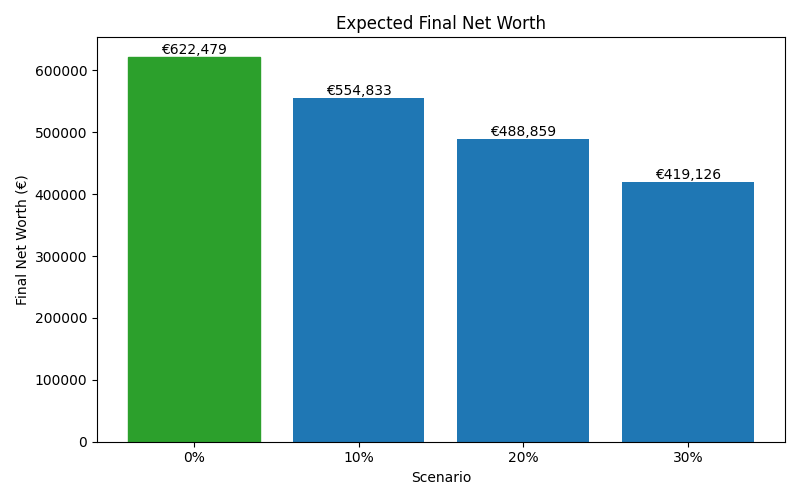
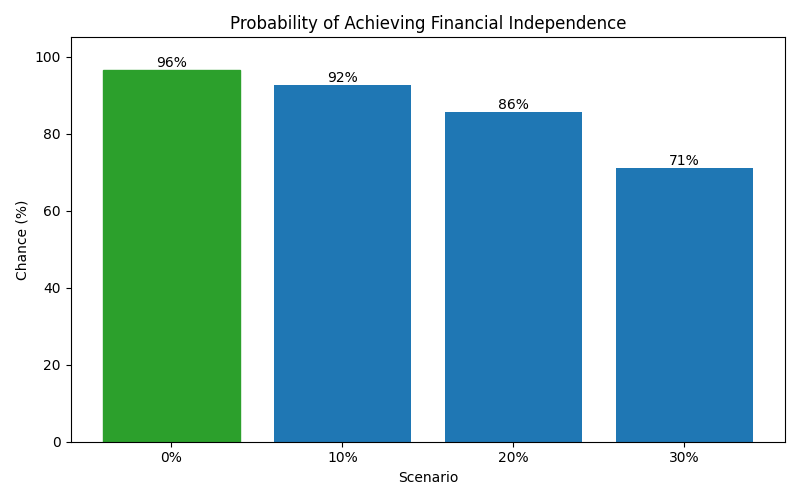
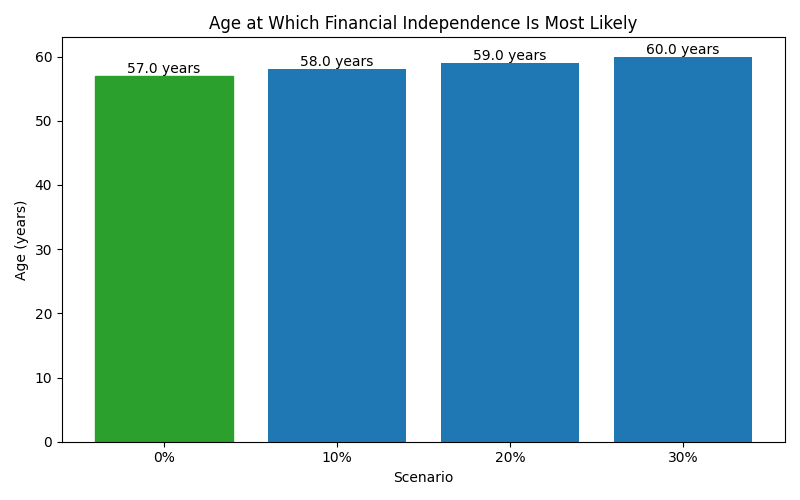
| 0% | 622,479 | 402,092 | 953,848 | 96% | 57 |
| 10% | 554,833 | 358,402 | 851,319 | 92% | 58 |
| 20% | 488,859 | 314,946 | 750,026 | 86% | 59 |
| 30% | 419,126 | 271,694 | 649,644 | 71% | 60 |
These charts show how each scenario affects long-term outcomes, including expected wealth, downside risk, and the likelihood of achieving financial independence.