Varied parameter
Income growth (annual)
1% → 5%
Software engineer in Barcelona · A volatile financial ride
This page compares financial outcomes for a Software engineer living in Barcelona, Spain, following the A volatile financial ride life scenario.
A highly unstable financial path combining income uncertainty, market swings, and repeated adverse events. Outcomes range widely, from recovery and growth to prolonged stagnation.
Barcelona combines a broad service and tech market with elevated living costs relative to the Spanish national average.
The comparison focuses on how changing the Income growth (annual) influences long-term results, while all other assumptions remain constant.
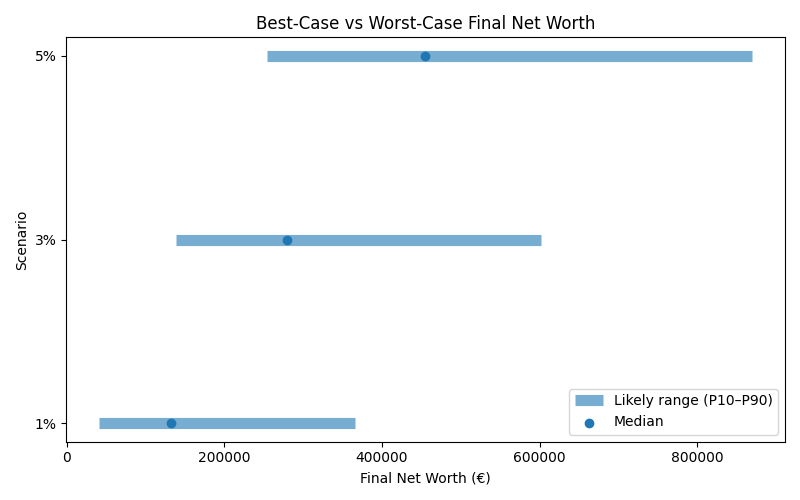
Results are shown as a realistic range. P10 represents a pessimistic outcome, while P90 represents an optimistic outcome. Most simulations fall between these two values.
| Scenario | Median Net Worth | P10 Net Worth | P90 Net Worth | FI Probability | FI Median Age |
|---|---|---|---|---|---|
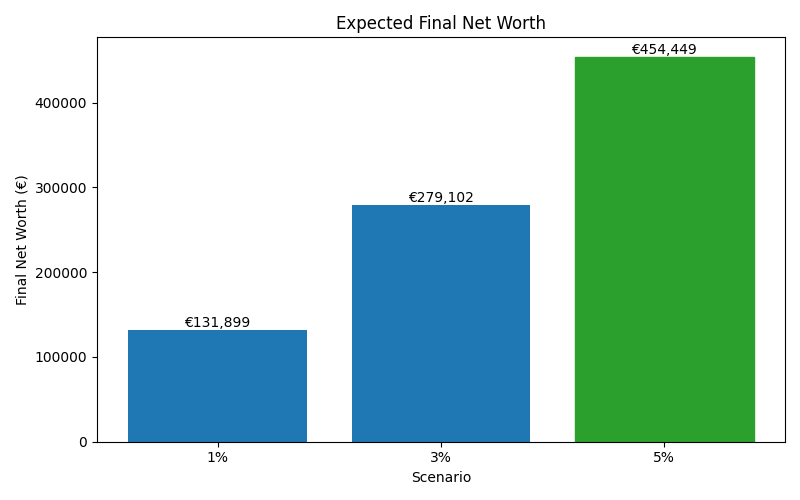
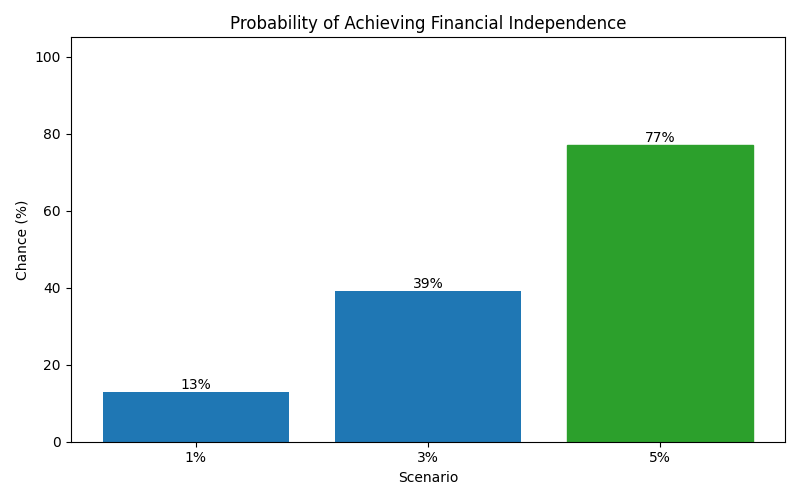
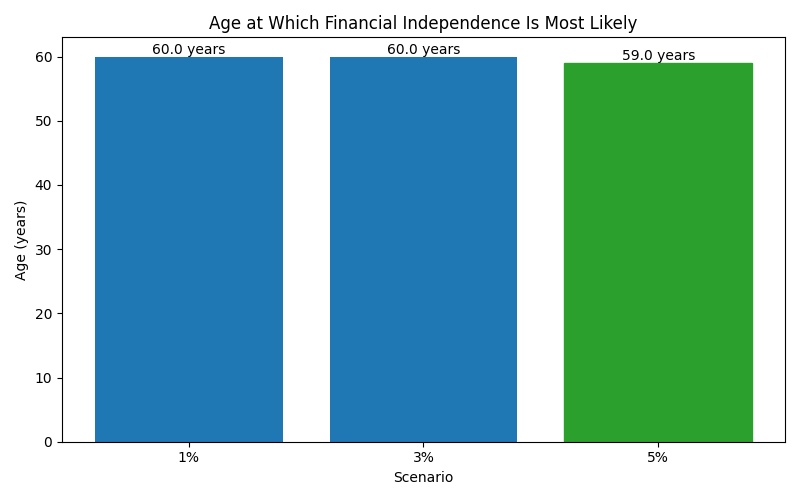
| 1% | 131,899 | 40,735 | 365,989 | 13% | 60 |
| 3% | 279,102 | 138,984 | 601,732 | 39% | 60 |
| 5% | 454,449 | 254,510 | 870,039 | 77% | 59 |
These charts show how each scenario affects long-term outcomes, including expected wealth, downside risk, and the likelihood of achieving financial independence.