Varied parameter
Saving rate
5% → 25%
Software engineer in Barcelona · A volatile financial ride
This page compares financial outcomes for a Software engineer living in Barcelona, Spain, following the A volatile financial ride life scenario.
A highly unstable financial path combining income uncertainty, market swings, and repeated adverse events. Outcomes range widely, from recovery and growth to prolonged stagnation.
Barcelona combines a broad service and tech market with elevated living costs relative to the Spanish national average.
The comparison focuses on how changing the Saving rate influences long-term results, while all other assumptions remain constant.
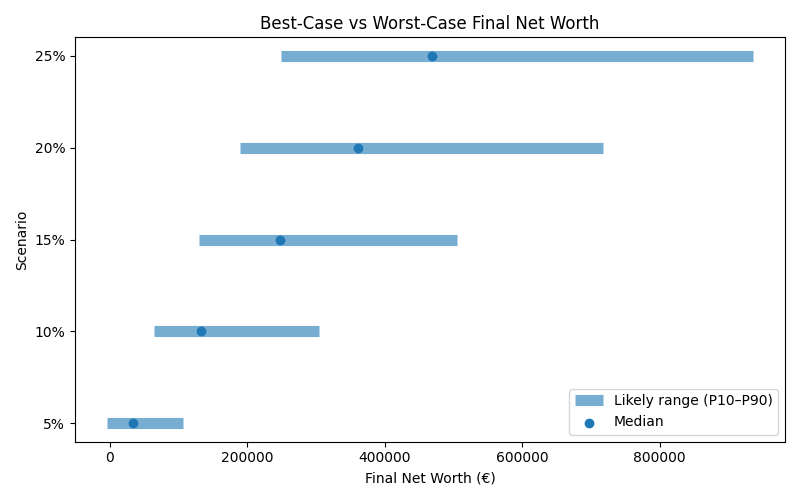
Results are shown as a realistic range. P10 represents a pessimistic outcome, while P90 represents an optimistic outcome. Most simulations fall between these two values.
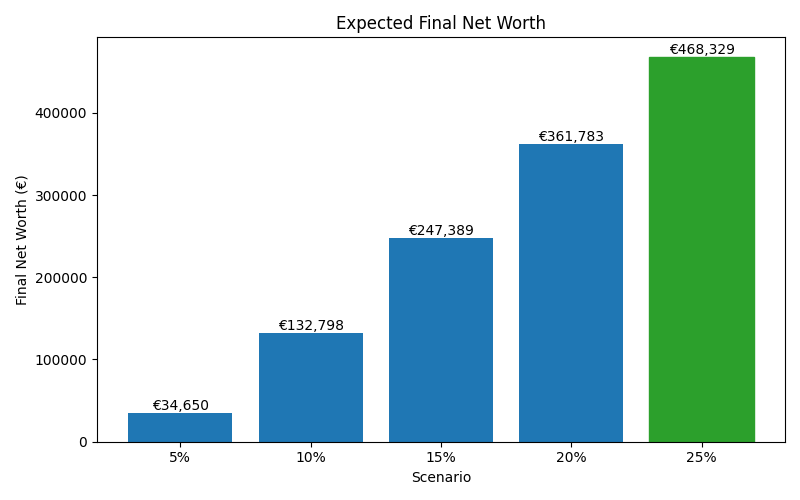
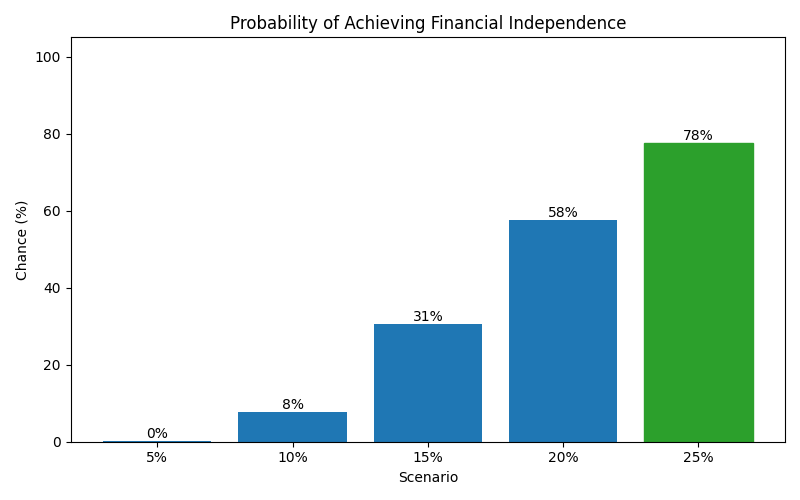
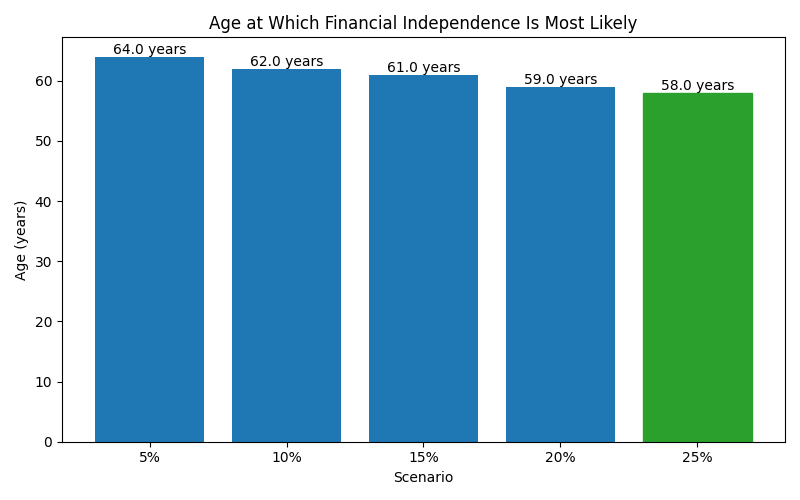
| Scenario | Median Net Worth | P10 Net Worth | P90 Net Worth | FI Probability | FI Median Age |
|---|---|---|---|---|---|
| 5% | 34,650 | -3,237 | 106,123 | 0% | 64 |
| 10% | 132,798 | 65,341 | 304,901 | 8% | 62 |
| 15% | 247,389 | 130,539 | 505,189 | 31% | 61 |
| 20% | 361,783 | 189,213 | 717,598 | 58% | 59 |
| 25% | 468,329 | 249,699 | 935,363 | 78% | 58 |
These charts show how each scenario affects long-term outcomes, including expected wealth, downside risk, and the likelihood of achieving financial independence.