Varied parameter
Saving rate
5% → 25%
Software engineer in Barcelona · Starting late
This page compares financial outcomes for a Software engineer living in Barcelona, Spain, following the Starting late life scenario.
A financial life that begins later, leaving fewer years for compounding to work. Success relies on disciplined saving, steady income, and sustained focus over a shorter horizon.
Barcelona combines a broad service and tech market with elevated living costs relative to the Spanish national average.
The comparison focuses on how changing the Saving rate influences long-term results, while all other assumptions remain constant.
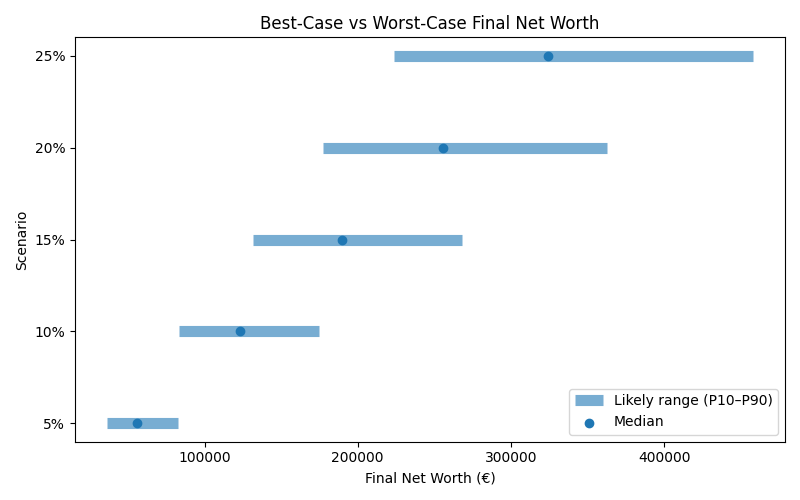
Results are shown as a realistic range. P10 represents a pessimistic outcome, while P90 represents an optimistic outcome. Most simulations fall between these two values.
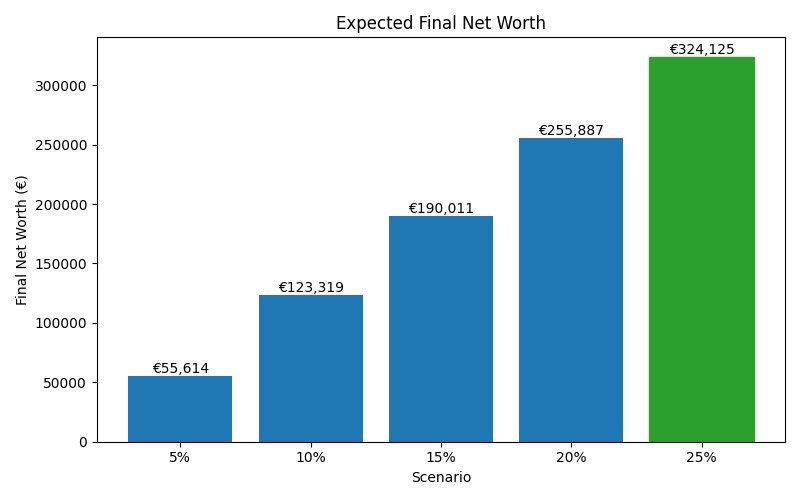
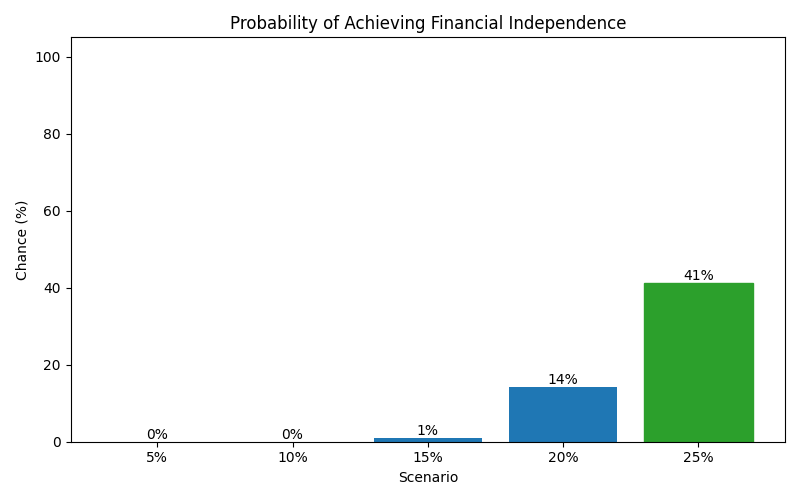
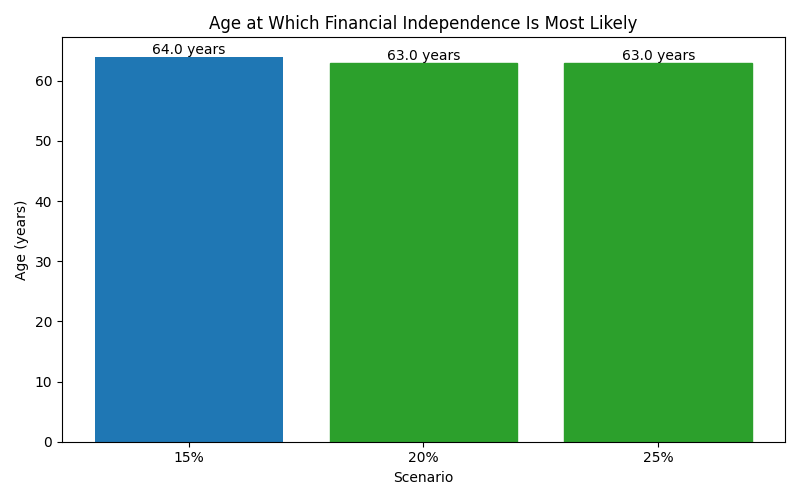
| Scenario | Median Net Worth | P10 Net Worth | P90 Net Worth | FI Probability | FI Median Age |
|---|---|---|---|---|---|
| 5% | 55,614 | 36,499 | 82,891 | 0% | — |
| 10% | 123,319 | 83,597 | 174,492 | 0% | — |
| 15% | 190,011 | 131,325 | 267,795 | 1% | 64 |
| 20% | 255,887 | 177,217 | 362,997 | 14% | 63 |
| 25% | 324,125 | 223,710 | 457,886 | 41% | 63 |
These charts show how each scenario affects long-term outcomes, including expected wealth, downside risk, and the likelihood of achieving financial independence.