Varied parameter
Investment return (expected)
3% → 7%
Software engineer in Barcelona · Peak earning years
This page compares financial outcomes for a Software engineer living in Barcelona, Spain, following the Peak earning years life scenario.
A high-income trajectory with strong saving capacity and rapid wealth accumulation. Compounding works faster here, but results remain exposed to market cycles and timing.
Barcelona combines a broad service and tech market with elevated living costs relative to the Spanish national average.
The comparison focuses on how changing the Investment return (expected) influences long-term results, while all other assumptions remain constant.
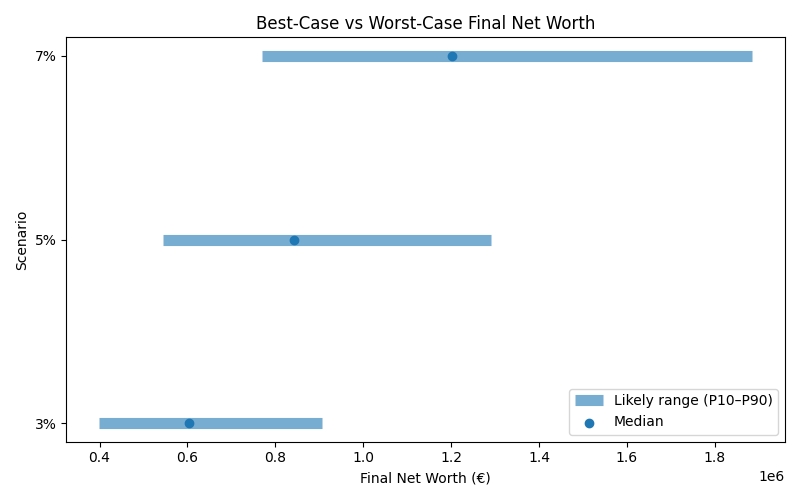
Results are shown as a realistic range. P10 represents a pessimistic outcome, while P90 represents an optimistic outcome. Most simulations fall between these two values.
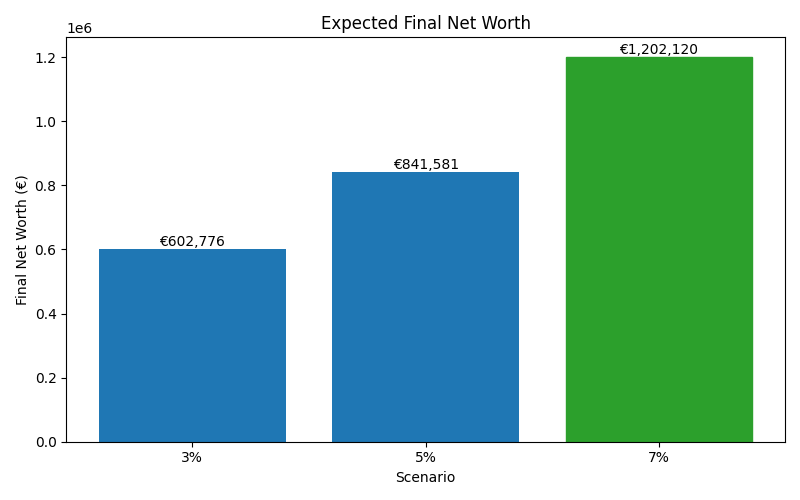
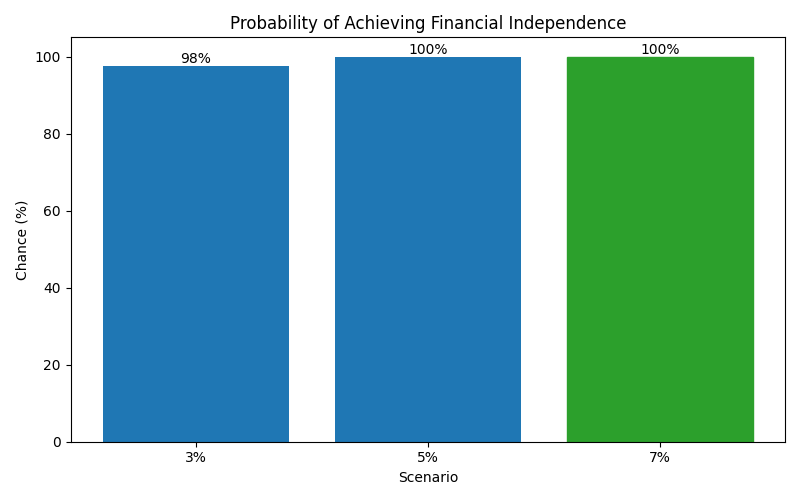
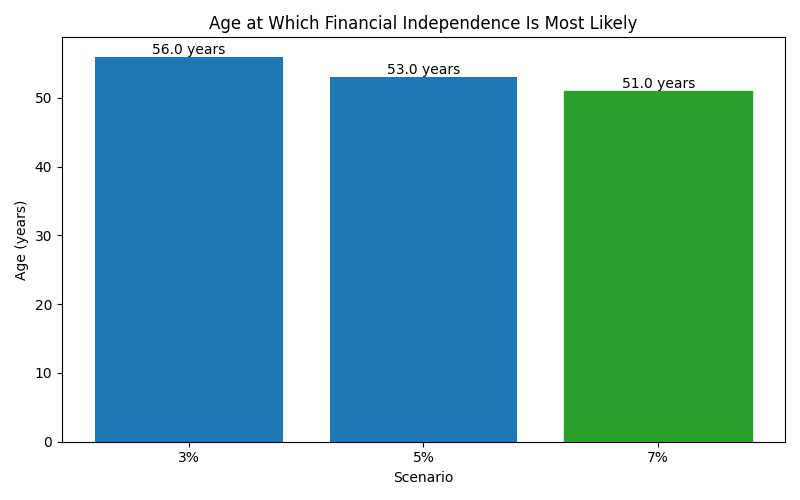
| Scenario | Median Net Worth | P10 Net Worth | P90 Net Worth | FI Probability | FI Median Age |
|---|---|---|---|---|---|
| 3% | 602,776 | 398,404 | 906,995 | 98% | 56 |
| 5% | 841,581 | 543,882 | 1,290,263 | 100% | 53 |
| 7% | 1,202,120 | 769,193 | 1,885,369 | 100% | 51 |
These charts show how each scenario affects long-term outcomes, including expected wealth, downside risk, and the likelihood of achieving financial independence.