Varied parameter
Saving rate
5% → 25%
Software engineer in Barcelona · Peak earning years
This page compares financial outcomes for a Software engineer living in Barcelona, Spain, following the Peak earning years life scenario.
A high-income trajectory with strong saving capacity and rapid wealth accumulation. Compounding works faster here, but results remain exposed to market cycles and timing.
Barcelona combines a broad service and tech market with elevated living costs relative to the Spanish national average.
The comparison focuses on how changing the Saving rate influences long-term results, while all other assumptions remain constant.
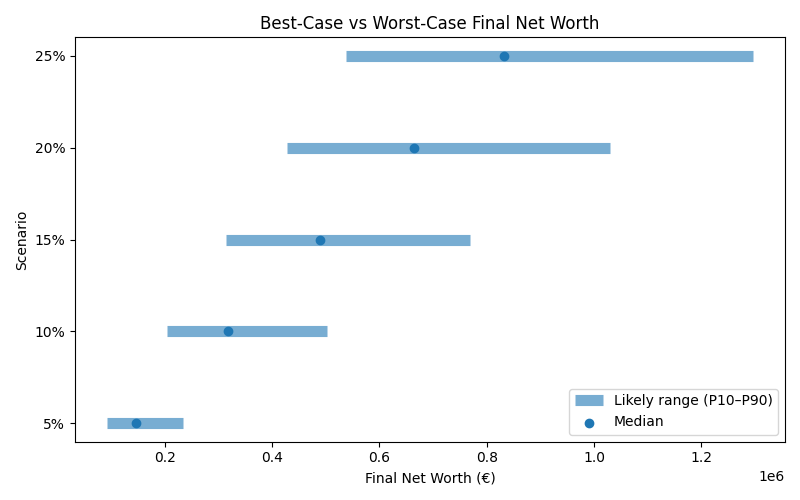
Results are shown as a realistic range. P10 represents a pessimistic outcome, while P90 represents an optimistic outcome. Most simulations fall between these two values.
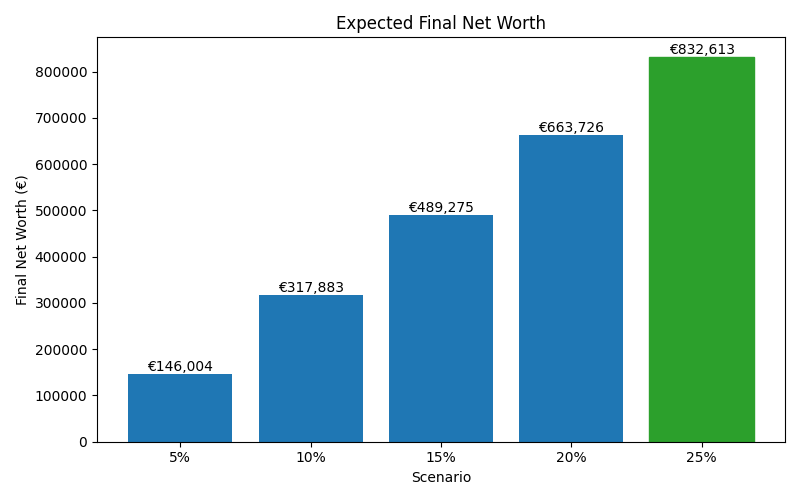
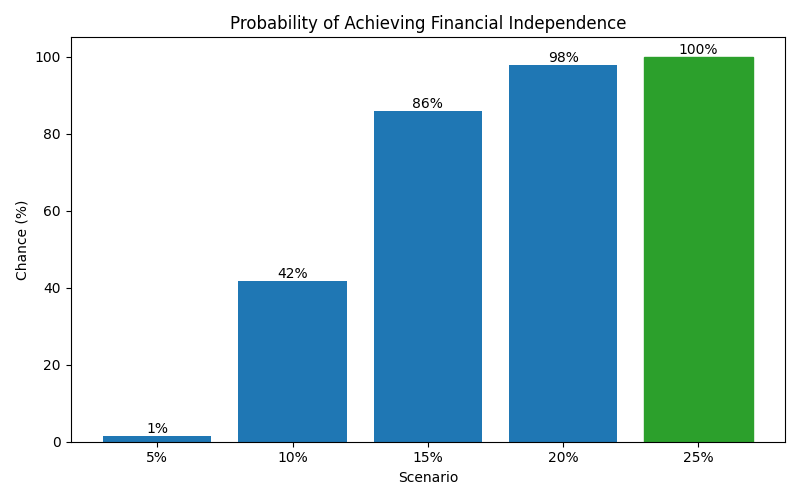
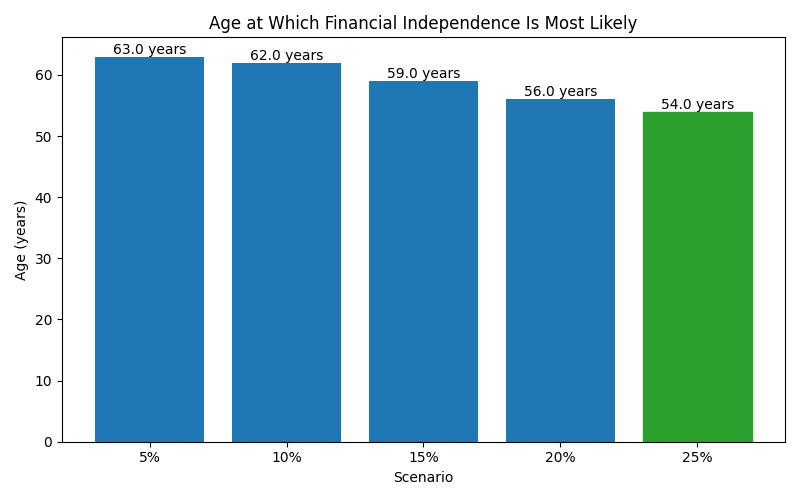
| Scenario | Median Net Worth | P10 Net Worth | P90 Net Worth | FI Probability | FI Median Age |
|---|---|---|---|---|---|
| 5% | 146,004 | 93,199 | 234,601 | 1% | 63 |
| 10% | 317,883 | 205,263 | 502,029 | 42% | 62 |
| 15% | 489,275 | 315,139 | 769,530 | 86% | 59 |
| 20% | 663,726 | 427,095 | 1,029,985 | 98% | 56 |
| 25% | 832,613 | 537,540 | 1,295,774 | 100% | 54 |
These charts show how each scenario affects long-term outcomes, including expected wealth, downside risk, and the likelihood of achieving financial independence.