Varied parameter
Saving rate
5% → 25%
Software engineer in Barcelona · Independent and uneven
This page compares financial outcomes for a Software engineer living in Barcelona, Spain, following the Independent and uneven life scenario.
A non-linear income path shaped by project-based work, variability, and self-managed risk. Flexibility is high, but consistency must be actively created rather than assumed.
Barcelona combines a broad service and tech market with elevated living costs relative to the Spanish national average.
The comparison focuses on how changing the Saving rate influences long-term results, while all other assumptions remain constant.
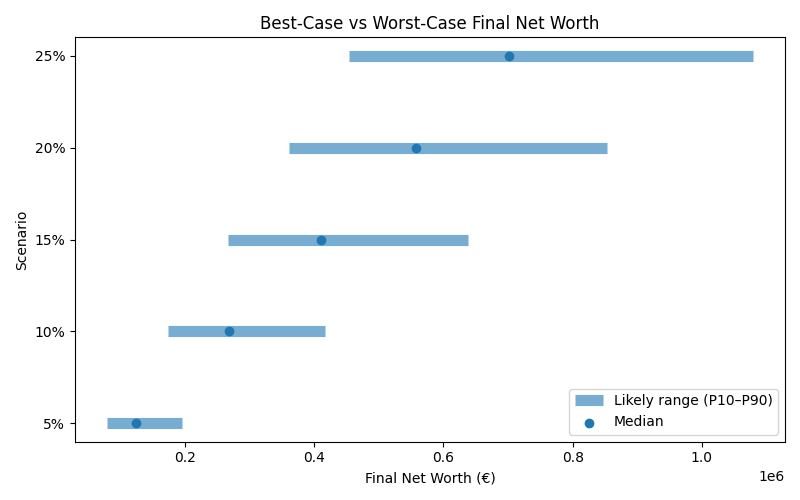
Results are shown as a realistic range. P10 represents a pessimistic outcome, while P90 represents an optimistic outcome. Most simulations fall between these two values.
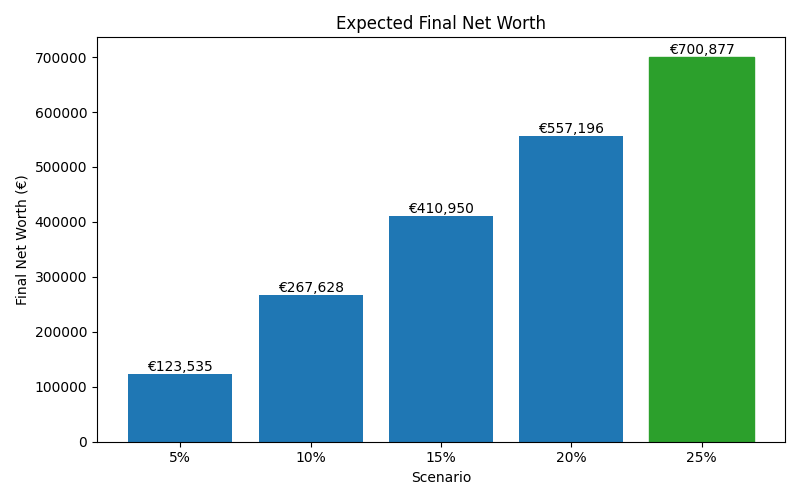
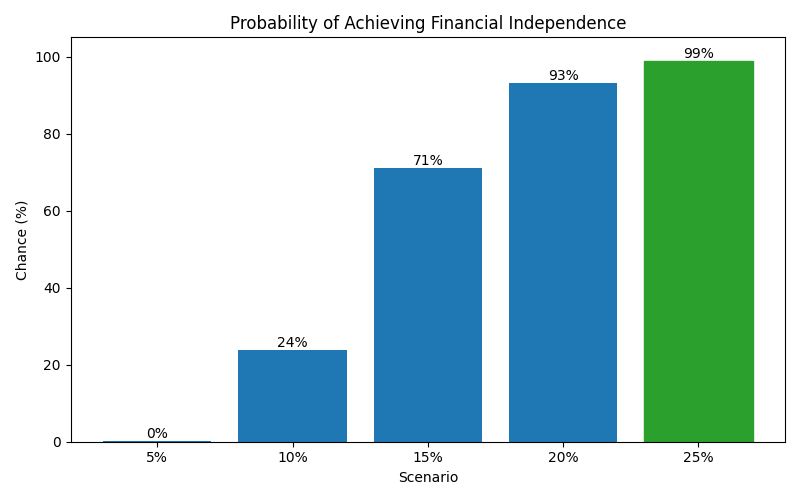
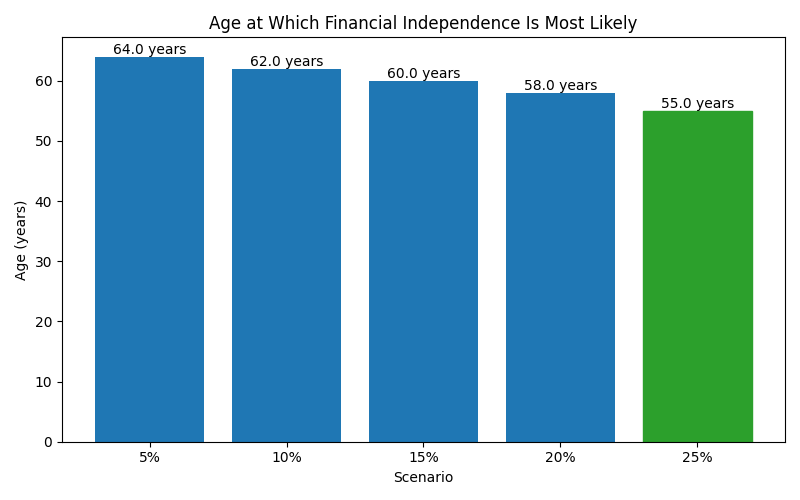
| Scenario | Median Net Worth | P10 Net Worth | P90 Net Worth | FI Probability | FI Median Age |
|---|---|---|---|---|---|
| 5% | 123,535 | 79,533 | 194,512 | 0% | 64 |
| 10% | 267,628 | 173,218 | 417,007 | 24% | 62 |
| 15% | 410,950 | 266,492 | 637,550 | 71% | 60 |
| 20% | 557,196 | 360,254 | 853,254 | 93% | 58 |
| 25% | 700,877 | 453,541 | 1,078,849 | 99% | 55 |
These charts show how each scenario affects long-term outcomes, including expected wealth, downside risk, and the likelihood of achieving financial independence.