Varied parameter
Income growth (annual)
1% → 5%
Software engineer in Barcelona · Fast-track independence
This page compares financial outcomes for a Software engineer living in Barcelona, Spain, following the Fast-track independence life scenario.
A high-intensity saving and investing strategy aimed at reaching financial independence as early as possible. Strong outcomes require discipline, sacrifice, and tolerance for market risk.
Barcelona combines a broad service and tech market with elevated living costs relative to the Spanish national average.
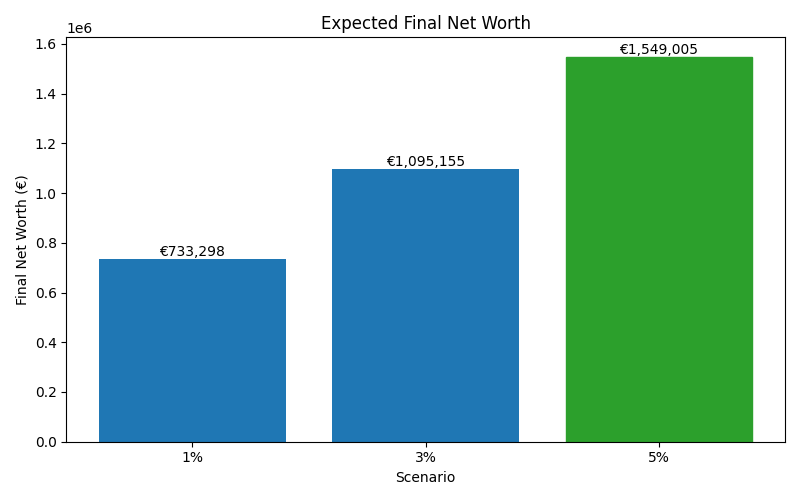
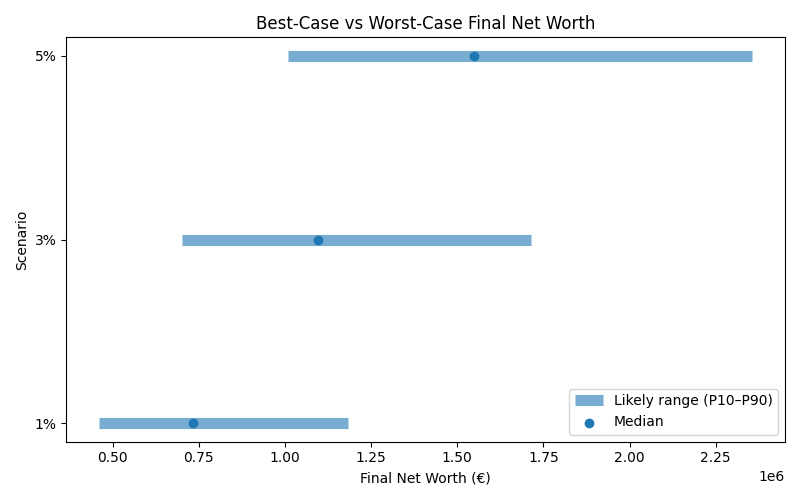
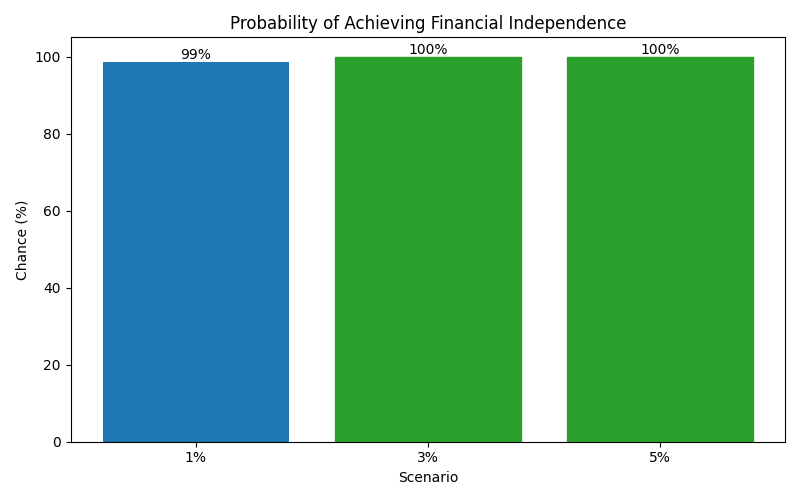
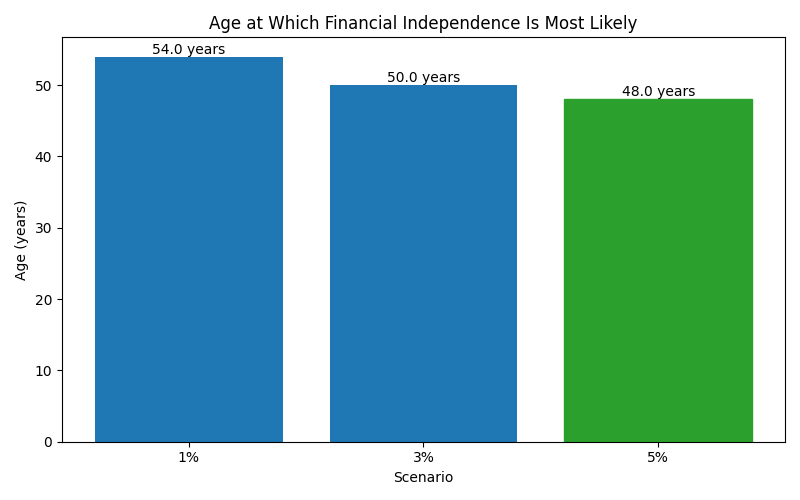
The comparison focuses on how changing the Income growth (annual) influences long-term results, while all other assumptions remain constant.
Results are shown as a realistic range. P10 represents a pessimistic outcome, while P90 represents an optimistic outcome. Most simulations fall between these two values.
| Scenario | Median Net Worth | P10 Net Worth | P90 Net Worth | FI Probability | FI Median Age |
|---|---|---|---|---|---|
| 1% | 733,298 | 460,349 | 1,182,289 | 99% | 54 |
| 3% | 1,095,155 | 701,567 | 1,715,277 | 100% | 50 |
| 5% | 1,549,005 | 1,008,540 | 2,356,089 | 100% | 48 |
These charts show how each scenario affects long-term outcomes, including expected wealth, downside risk, and the likelihood of achieving financial independence.