Varied parameter
Income growth (annual)
1% → 5%
Software engineer in Bucharest · Independent and uneven
This page compares financial outcomes for a Software engineer living in Bucharest, Romania, following the Independent and uneven life scenario.
A non-linear income path shaped by project-based work, variability, and self-managed risk. Flexibility is high, but consistency must be actively created rather than assumed.
Bucharest offers the highest income potential in Romania, along with higher living costs and more competitive job markets.
The comparison focuses on how changing the Income growth (annual) influences long-term results, while all other assumptions remain constant.
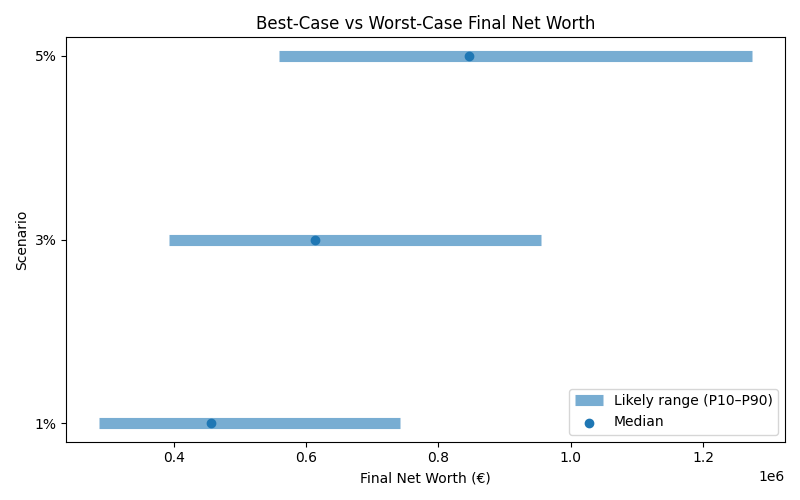
Results are shown as a realistic range. P10 represents a pessimistic outcome, while P90 represents an optimistic outcome. Most simulations fall between these two values.
| Scenario | Median Net Worth | P10 Net Worth | P90 Net Worth | FI Probability | FI Median Age |
|---|---|---|---|---|---|
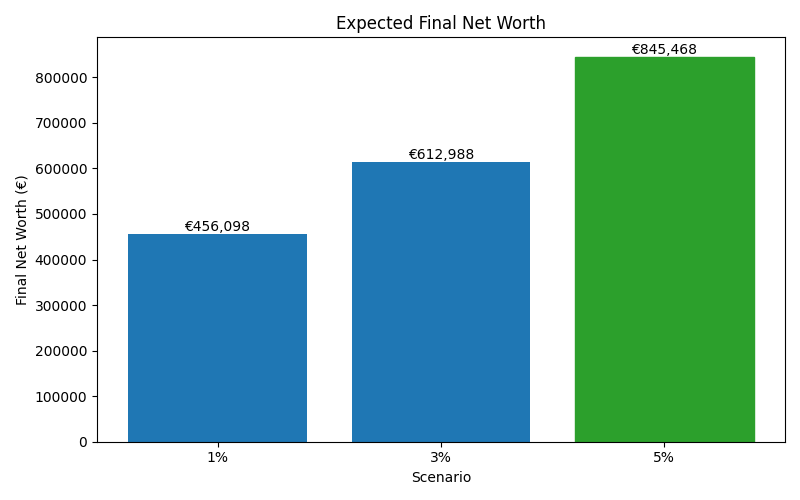
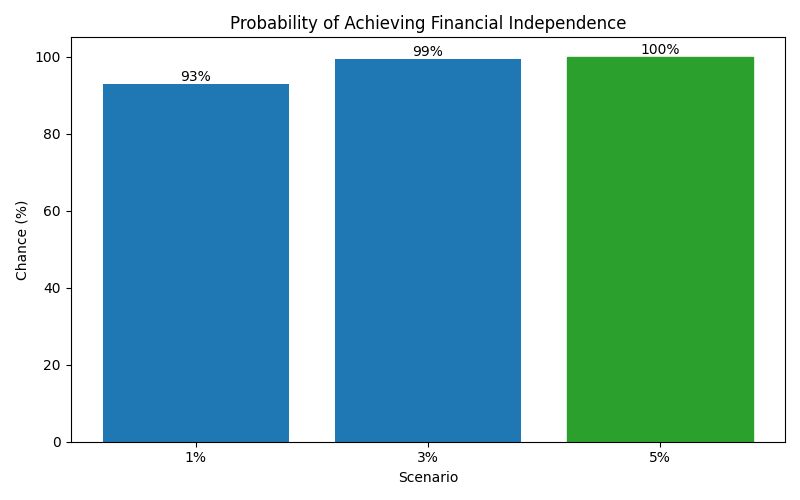
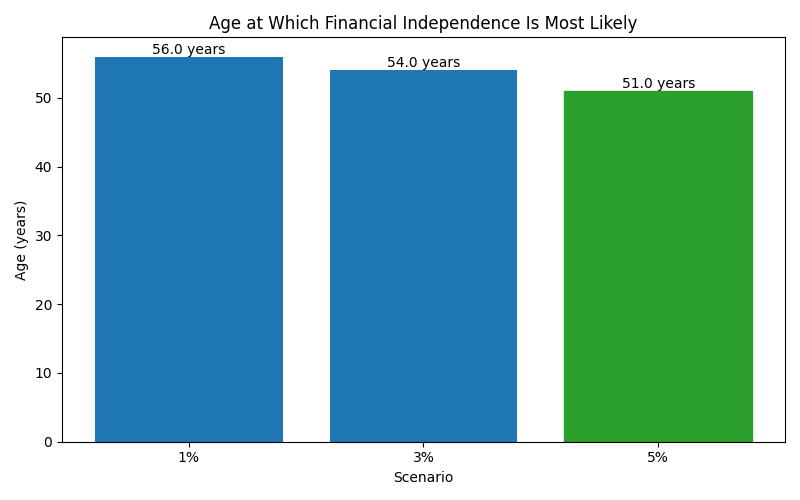
| 1% | 456,098 | 286,775 | 742,382 | 93% | 56 |
| 3% | 612,988 | 392,562 | 954,610 | 99% | 54 |
| 5% | 845,468 | 559,438 | 1,274,453 | 100% | 51 |
These charts show how each scenario affects long-term outcomes, including expected wealth, downside risk, and the likelihood of achieving financial independence.