Varied parameter
Saving rate
5% → 25%
Software engineer in Bucharest · Fast-track independence
This page compares financial outcomes for a Software engineer living in Bucharest, Romania, following the Fast-track independence life scenario.
A high-intensity saving and investing strategy aimed at reaching financial independence as early as possible. Strong outcomes require discipline, sacrifice, and tolerance for market risk.
Bucharest offers the highest income potential in Romania, along with higher living costs and more competitive job markets.
The comparison focuses on how changing the Saving rate influences long-term results, while all other assumptions remain constant.
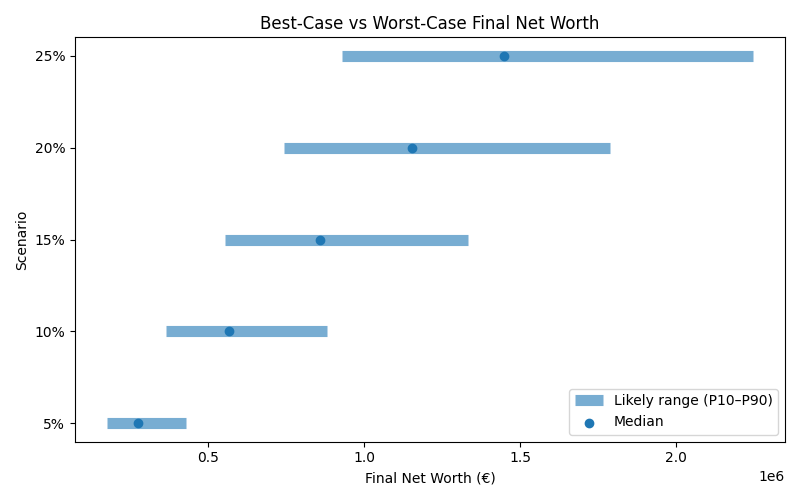
Results are shown as a realistic range. P10 represents a pessimistic outcome, while P90 represents an optimistic outcome. Most simulations fall between these two values.
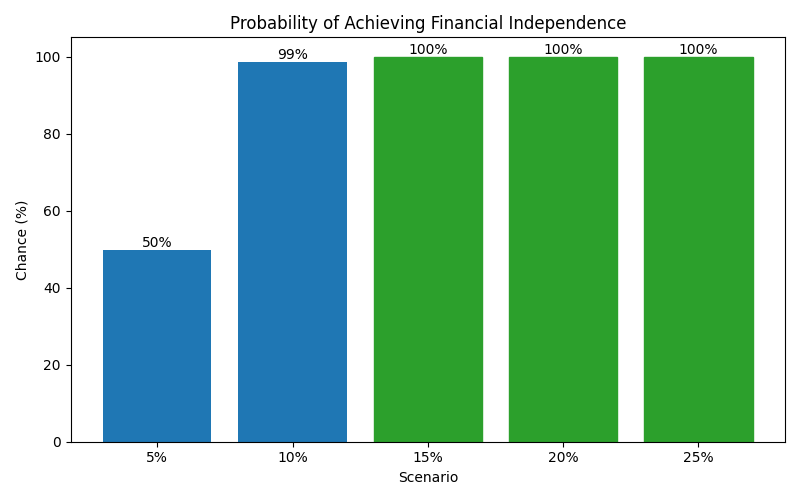
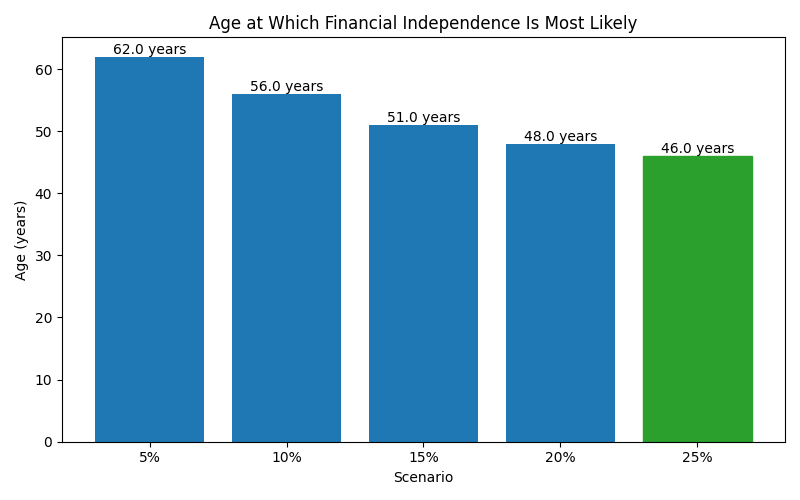
| Scenario | Median Net Worth | P10 Net Worth | P90 Net Worth | FI Probability | FI Median Age |
|---|---|---|---|---|---|
| 5% | 274,920 | 177,400 | 429,124 | 50% | 62 |
| 10% | 567,301 | 366,370 | 880,826 | 99% | 56 |
| 15% | 860,142 | 553,408 | 1,332,009 | 100% | 51 |
| 20% | 1,153,872 | 741,929 | 1,788,820 | 100% | 48 |
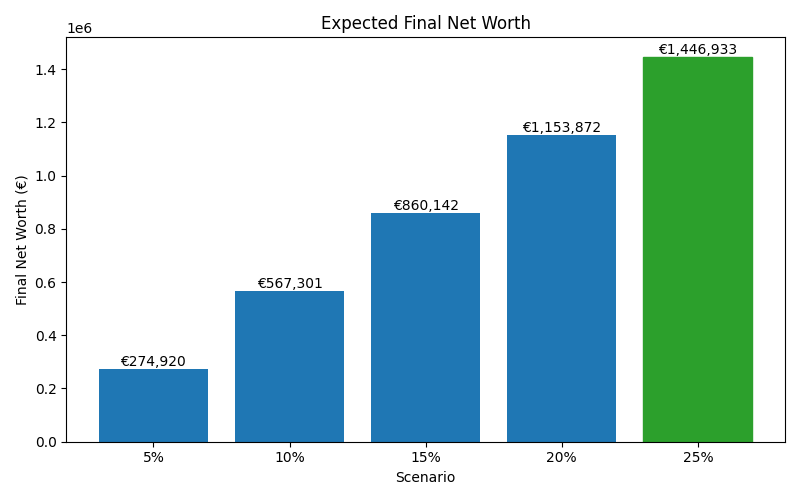
| 25% | 1,446,933 | 929,089 | 2,244,693 | 100% | 46 |
These charts show how each scenario affects long-term outcomes, including expected wealth, downside risk, and the likelihood of achieving financial independence.