Varied parameter
Investment return (expected)
3% → 7%
Software engineer in Munich · The steady builder
This page compares financial outcomes for a Software engineer living in Munich, Germany, following the The steady builder life scenario.
A balanced financial life built on predictable income growth, consistent saving, and long-term market participation. Progress comes from patience, stability, and compounding over time.
Munich offers very strong income potential in high-skill sectors, along with some of the highest living costs in Germany.
The comparison focuses on how changing the Investment return (expected) influences long-term results, while all other assumptions remain constant.
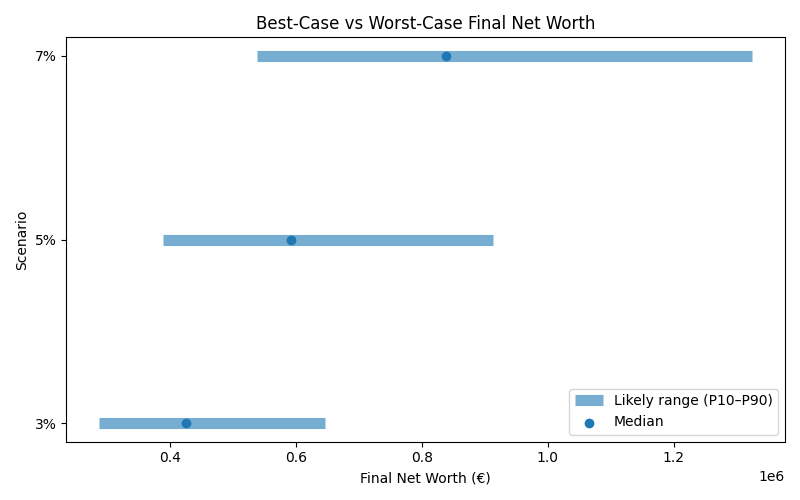
Results are shown as a realistic range. P10 represents a pessimistic outcome, while P90 represents an optimistic outcome. Most simulations fall between these two values.
| Scenario | Median Net Worth | P10 Net Worth | P90 Net Worth | FI Probability | FI Median Age |
|---|---|---|---|---|---|
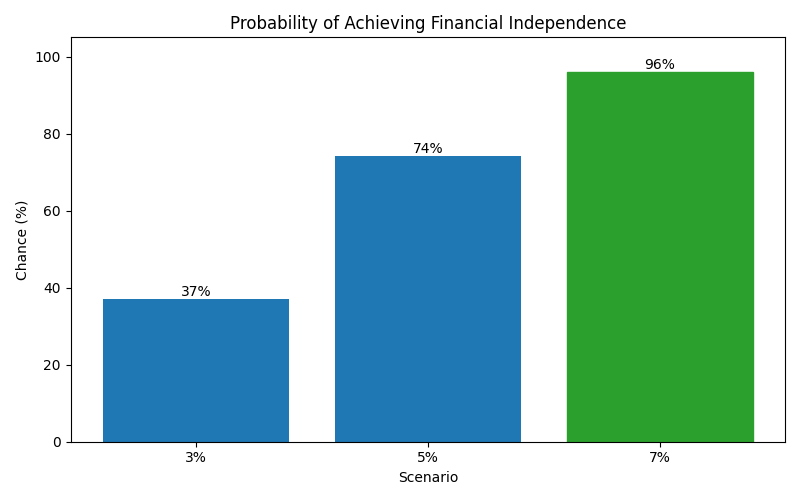
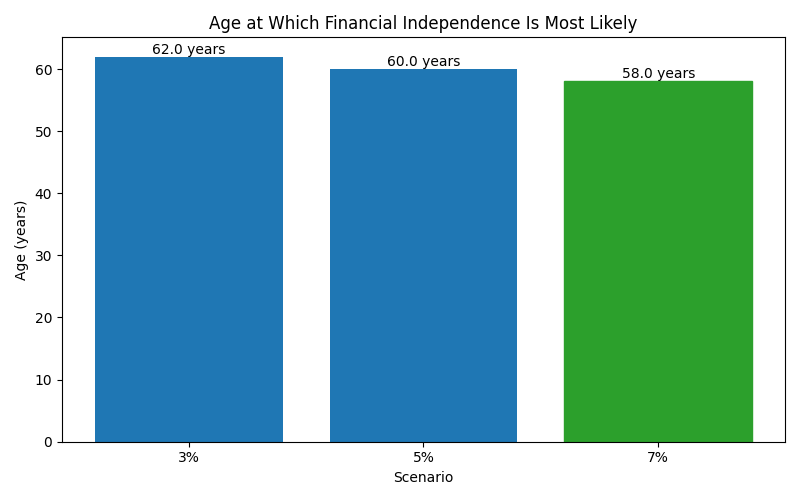
| 3% | 426,372 | 287,229 | 645,772 | 37% | 62 |
| 5% | 591,700 | 389,404 | 913,612 | 74% | 60 |
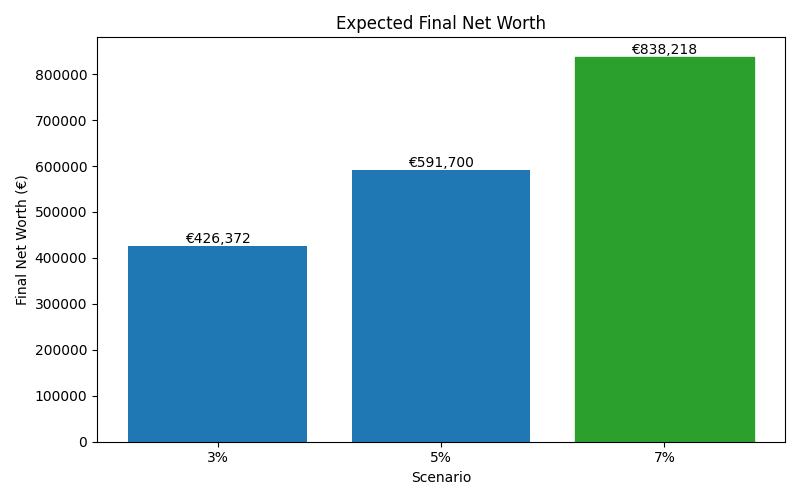
| 7% | 838,218 | 537,998 | 1,324,720 | 96% | 58 |
These charts show how each scenario affects long-term outcomes, including expected wealth, downside risk, and the likelihood of achieving financial independence.