Varied parameter
Income tax rate
0% → 30%
Software engineer in Munich · The steady builder
This page compares financial outcomes for a Software engineer living in Munich, Germany, following the The steady builder life scenario.
A balanced financial life built on predictable income growth, consistent saving, and long-term market participation. Progress comes from patience, stability, and compounding over time.
Munich offers very strong income potential in high-skill sectors, along with some of the highest living costs in Germany.
The comparison focuses on how changing the Income tax rate influences long-term results, while all other assumptions remain constant.
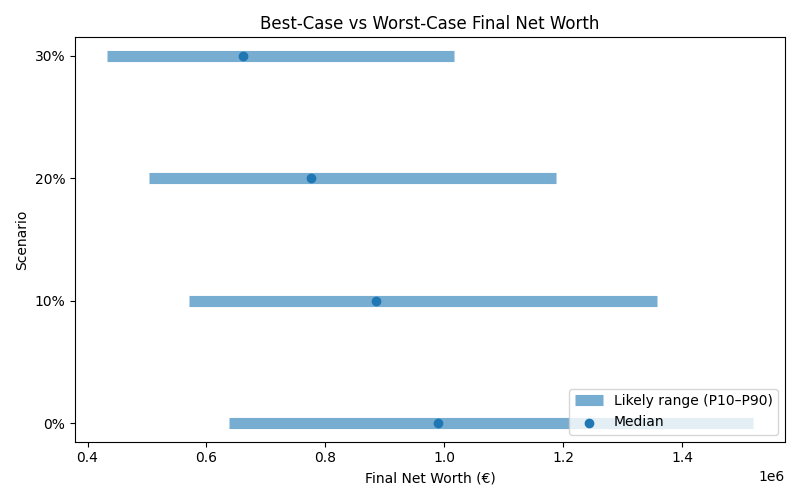
Results are shown as a realistic range. P10 represents a pessimistic outcome, while P90 represents an optimistic outcome. Most simulations fall between these two values.
| Scenario | Median Net Worth | P10 Net Worth | P90 Net Worth | FI Probability | FI Median Age |
|---|---|---|---|---|---|
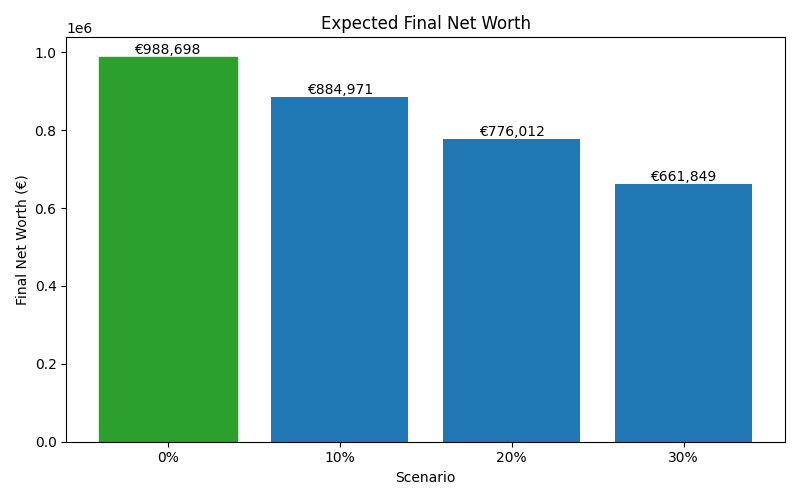
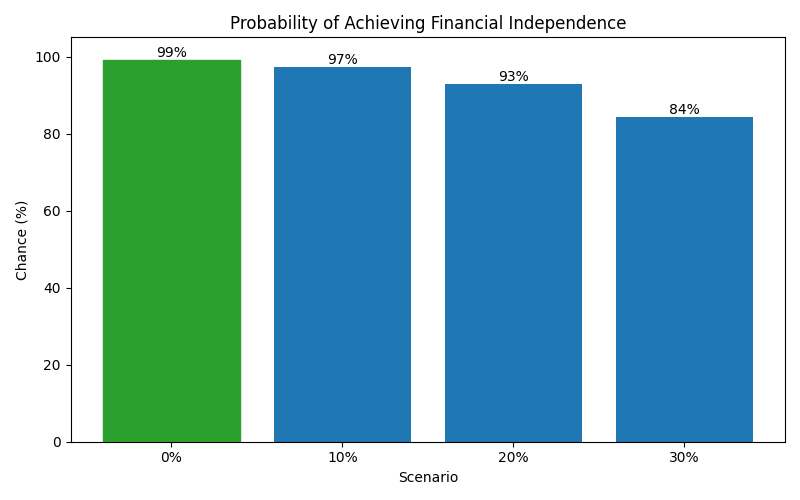
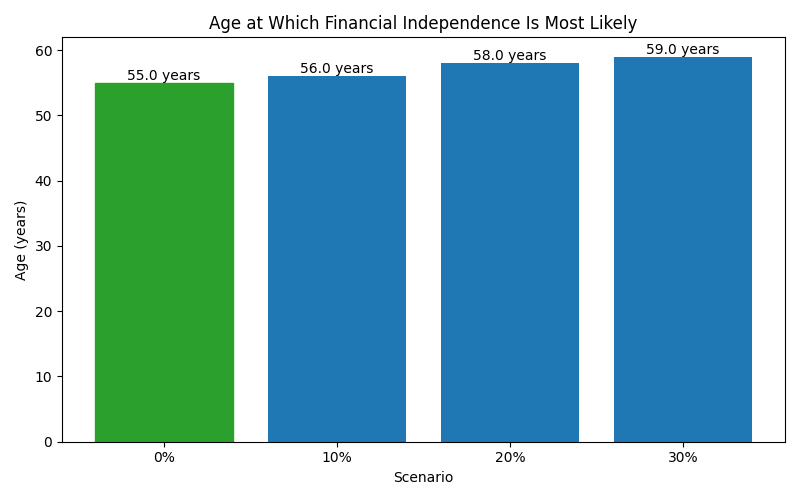
| 0% | 988,698 | 637,924 | 1,518,498 | 99% | 55 |
| 10% | 884,971 | 569,974 | 1,357,166 | 97% | 56 |
| 20% | 776,012 | 503,970 | 1,187,169 | 93% | 58 |
| 30% | 661,849 | 433,197 | 1,015,676 | 84% | 59 |
These charts show how each scenario affects long-term outcomes, including expected wealth, downside risk, and the likelihood of achieving financial independence.