Varied parameter
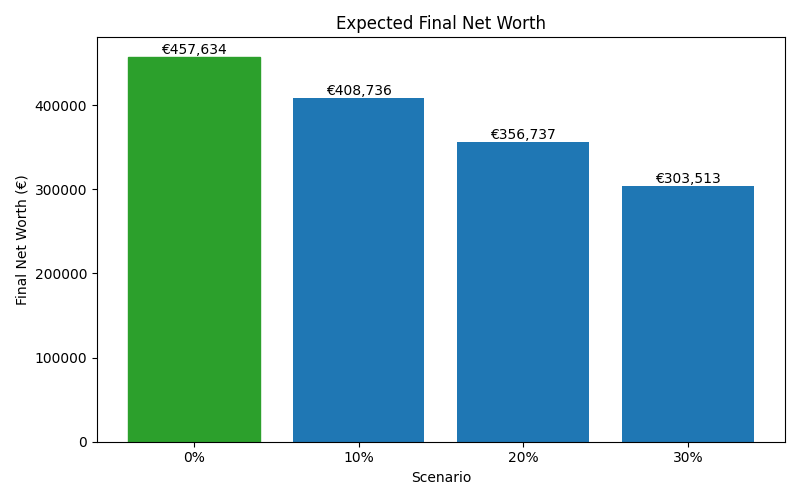
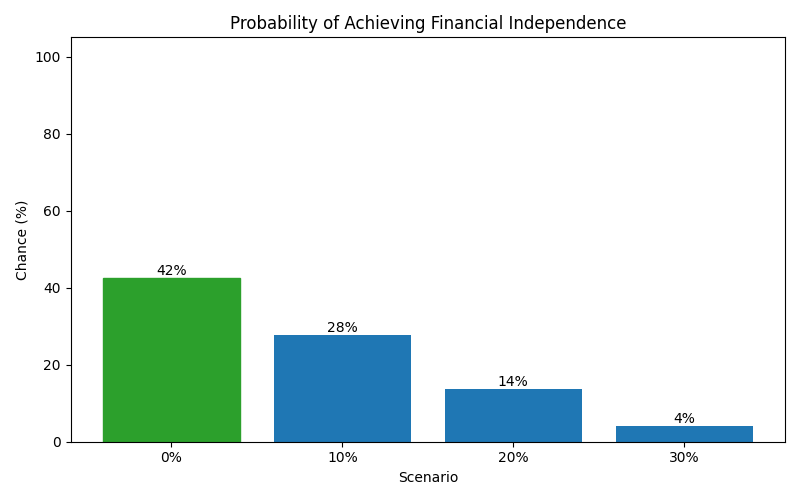
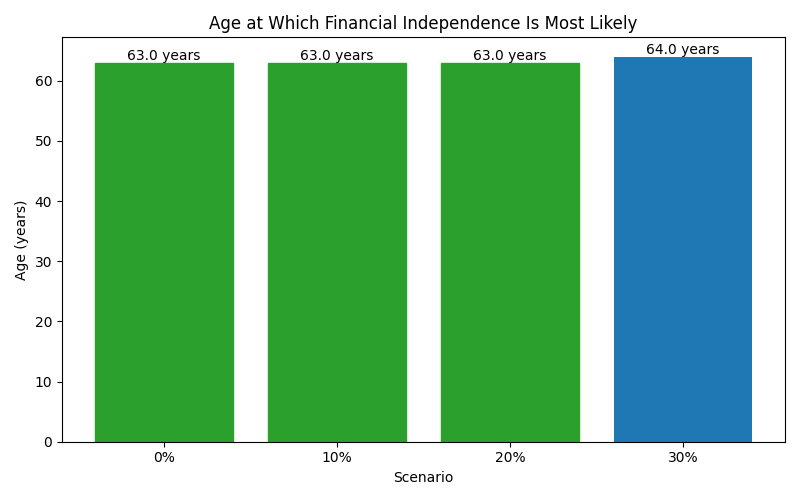
Income tax rate
0% → 30%
Software engineer in Munich · Starting late
This page compares financial outcomes for a Software engineer living in Munich, Germany, following the Starting late life scenario.
A financial life that begins later, leaving fewer years for compounding to work. Success relies on disciplined saving, steady income, and sustained focus over a shorter horizon.
Munich offers very strong income potential in high-skill sectors, along with some of the highest living costs in Germany.
The comparison focuses on how changing the Income tax rate influences long-term results, while all other assumptions remain constant.
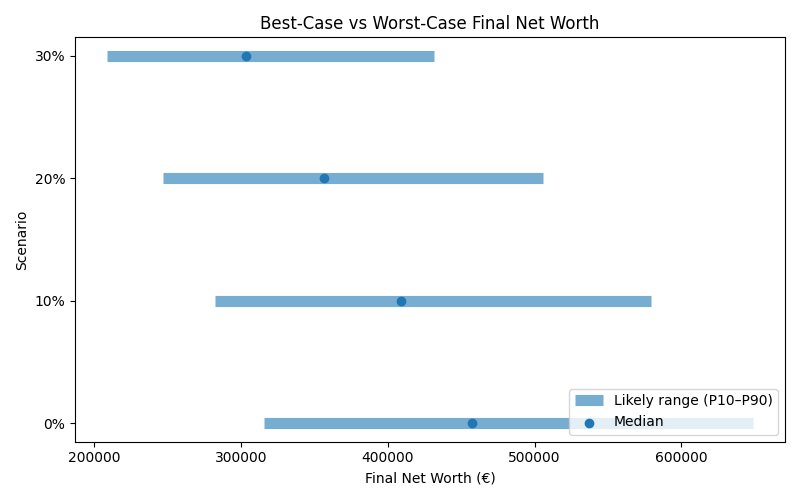
Results are shown as a realistic range. P10 represents a pessimistic outcome, while P90 represents an optimistic outcome. Most simulations fall between these two values.
| Scenario | Median Net Worth | P10 Net Worth | P90 Net Worth | FI Probability | FI Median Age |
|---|---|---|---|---|---|
| 0% | 457,634 | 316,019 | 648,625 | 42% | 63 |
| 10% | 408,736 | 282,450 | 579,409 | 28% | 63 |
| 20% | 356,737 | 246,985 | 506,081 | 14% | 63 |
| 30% | 303,513 | 208,952 | 431,683 | 4% | 64 |
These charts show how each scenario affects long-term outcomes, including expected wealth, downside risk, and the likelihood of achieving financial independence.