Varied parameter
Income growth (annual)
1% → 5%
Software engineer in Hamburg · A volatile financial ride
This page compares financial outcomes for a Software engineer living in Hamburg, Germany, following the A volatile financial ride life scenario.
A highly unstable financial path combining income uncertainty, market swings, and repeated adverse events. Outcomes range widely, from recovery and growth to prolonged stagnation.
Hamburg has a strong professional services and logistics economy, with above-average costs and solid income potential.
The comparison focuses on how changing the Income growth (annual) influences long-term results, while all other assumptions remain constant.
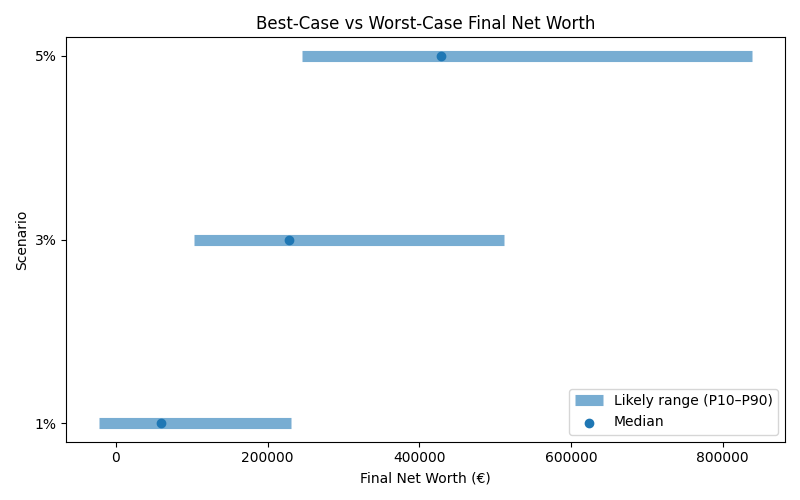
Results are shown as a realistic range. P10 represents a pessimistic outcome, while P90 represents an optimistic outcome. Most simulations fall between these two values.
| Scenario | Median Net Worth | P10 Net Worth | P90 Net Worth | FI Probability | FI Median Age |
|---|---|---|---|---|---|
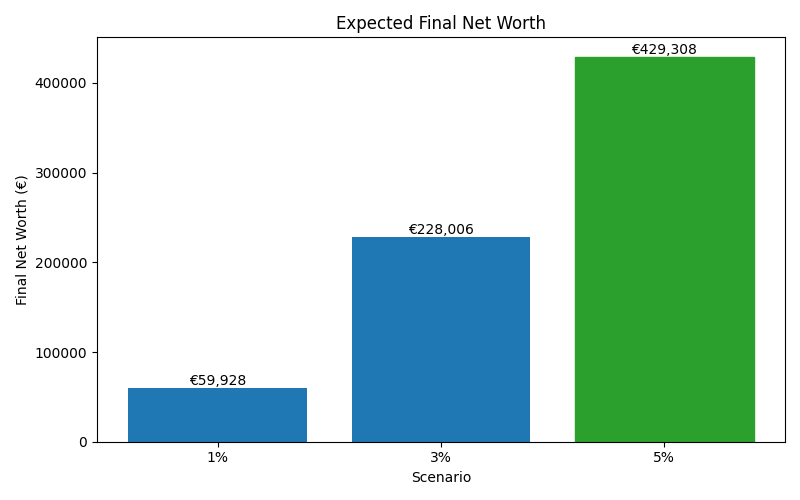
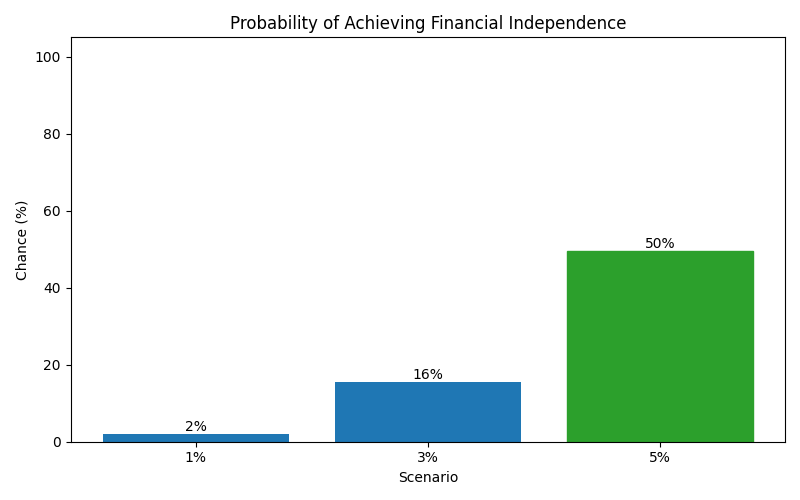
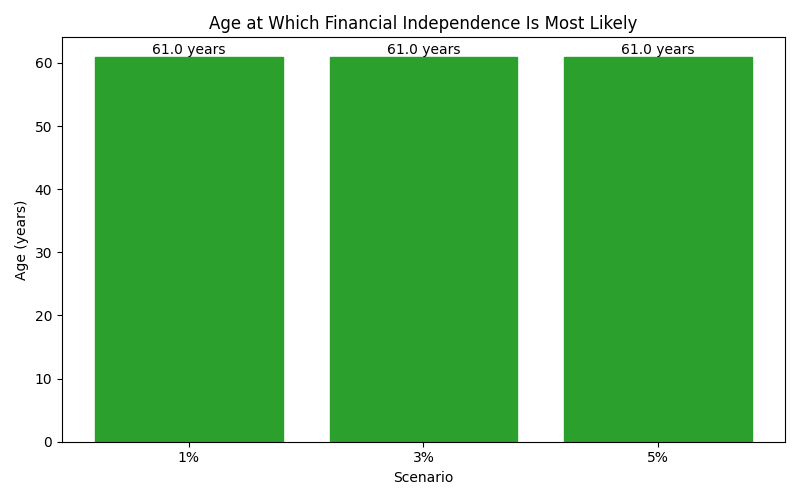
| 1% | 59,928 | -22,400 | 231,197 | 2% | 61 |
| 3% | 228,006 | 103,195 | 511,250 | 16% | 61 |
| 5% | 429,308 | 246,052 | 839,333 | 50% | 61 |
These charts show how each scenario affects long-term outcomes, including expected wealth, downside risk, and the likelihood of achieving financial independence.