Varied parameter
Saving rate
5% → 25%
Software engineer in Hamburg · A volatile financial ride
This page compares financial outcomes for a Software engineer living in Hamburg, Germany, following the A volatile financial ride life scenario.
A highly unstable financial path combining income uncertainty, market swings, and repeated adverse events. Outcomes range widely, from recovery and growth to prolonged stagnation.
Hamburg has a strong professional services and logistics economy, with above-average costs and solid income potential.
The comparison focuses on how changing the Saving rate influences long-term results, while all other assumptions remain constant.
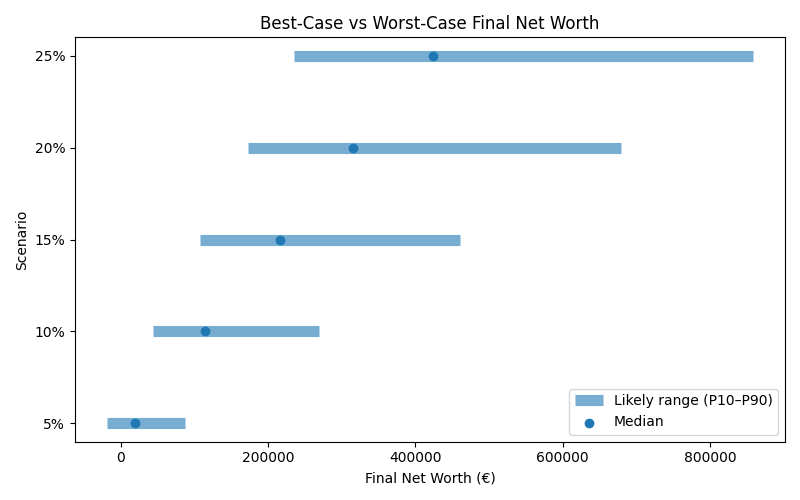
Results are shown as a realistic range. P10 represents a pessimistic outcome, while P90 represents an optimistic outcome. Most simulations fall between these two values.
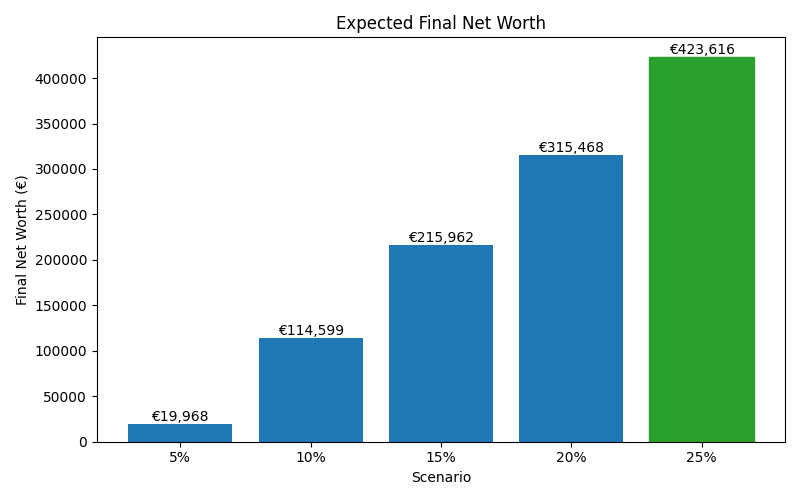
| Scenario | Median Net Worth | P10 Net Worth | P90 Net Worth | FI Probability | FI Median Age |
|---|---|---|---|---|---|
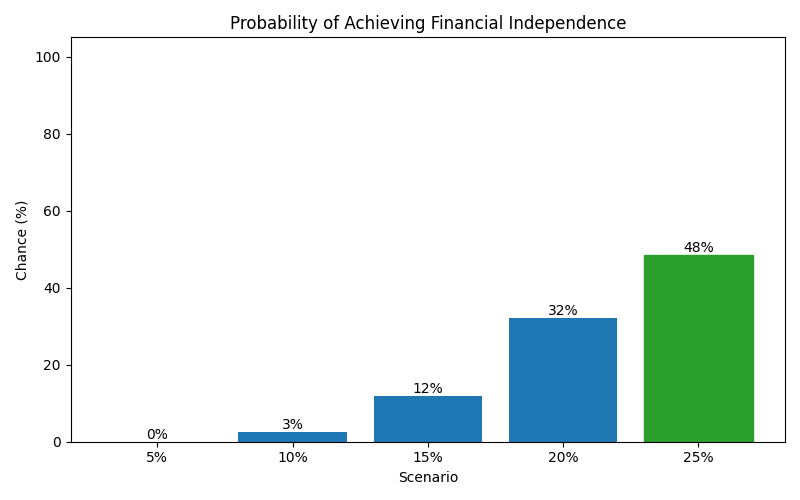
| 5% | 19,968 | -18,212 | 87,674 | 0% | — |
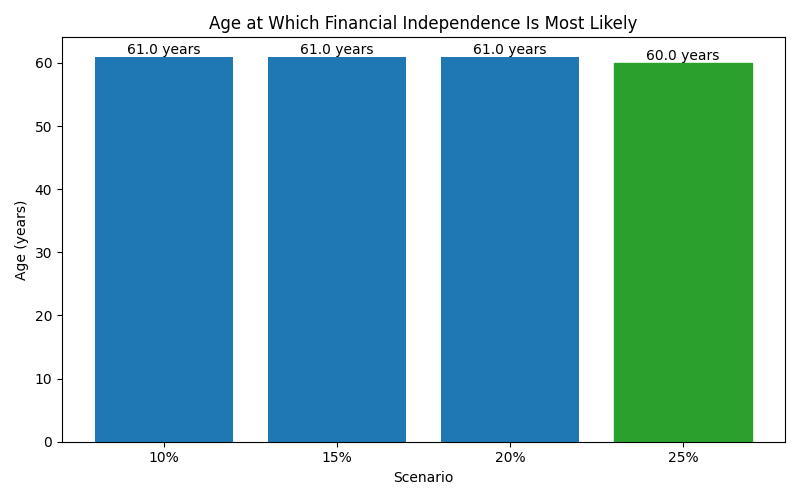
| 10% | 114,599 | 43,553 | 268,606 | 3% | 61 |
| 15% | 215,962 | 107,199 | 460,706 | 12% | 61 |
| 20% | 315,468 | 172,465 | 679,310 | 32% | 61 |
| 25% | 423,616 | 234,740 | 857,994 | 48% | 60 |
These charts show how each scenario affects long-term outcomes, including expected wealth, downside risk, and the likelihood of achieving financial independence.