Varied parameter
Saving rate
5% → 25%
Software engineer in Hamburg · Starting late
This page compares financial outcomes for a Software engineer living in Hamburg, Germany, following the Starting late life scenario.
A financial life that begins later, leaving fewer years for compounding to work. Success relies on disciplined saving, steady income, and sustained focus over a shorter horizon.
Hamburg has a strong professional services and logistics economy, with above-average costs and solid income potential.
The comparison focuses on how changing the Saving rate influences long-term results, while all other assumptions remain constant.
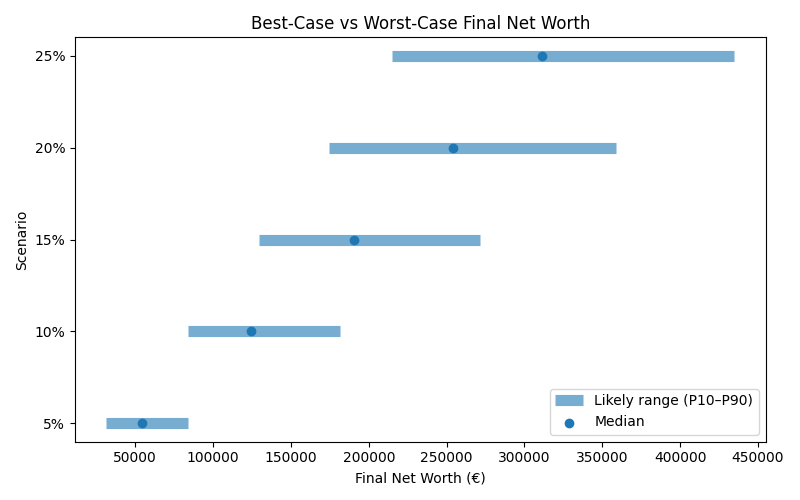
Results are shown as a realistic range. P10 represents a pessimistic outcome, while P90 represents an optimistic outcome. Most simulations fall between these two values.
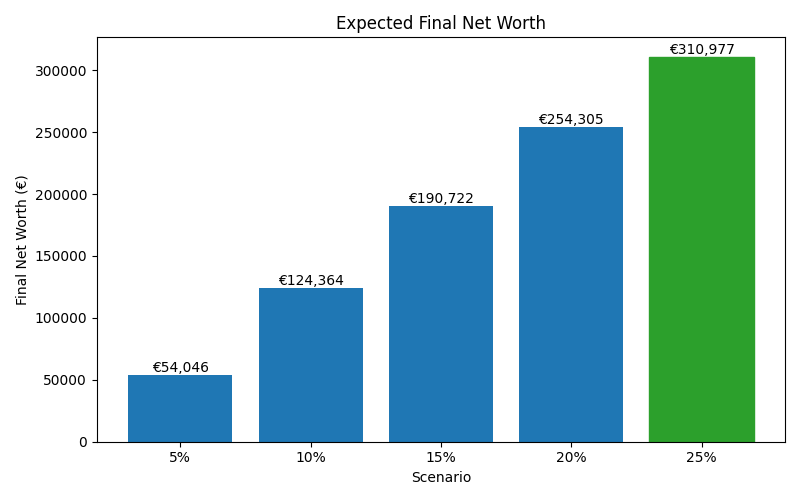
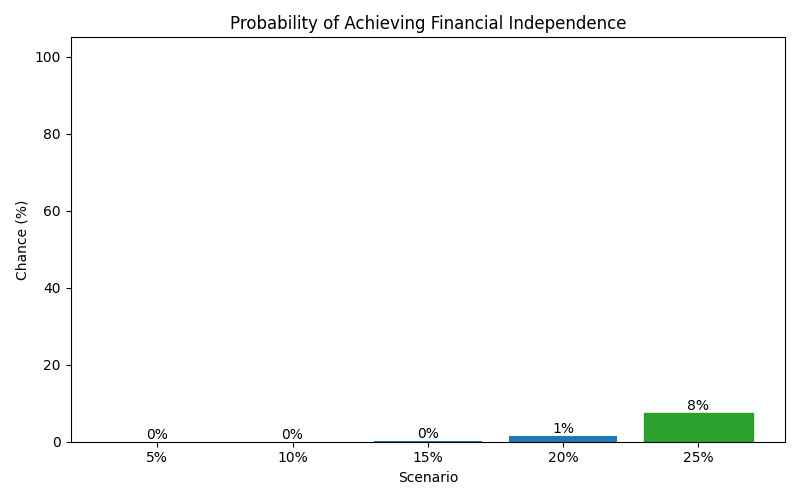
| Scenario | Median Net Worth | P10 Net Worth | P90 Net Worth | FI Probability | FI Median Age |
|---|---|---|---|---|---|
| 5% | 54,046 | 31,474 | 83,876 | 0% | — |
| 10% | 124,364 | 83,583 | 181,449 | 0% | — |
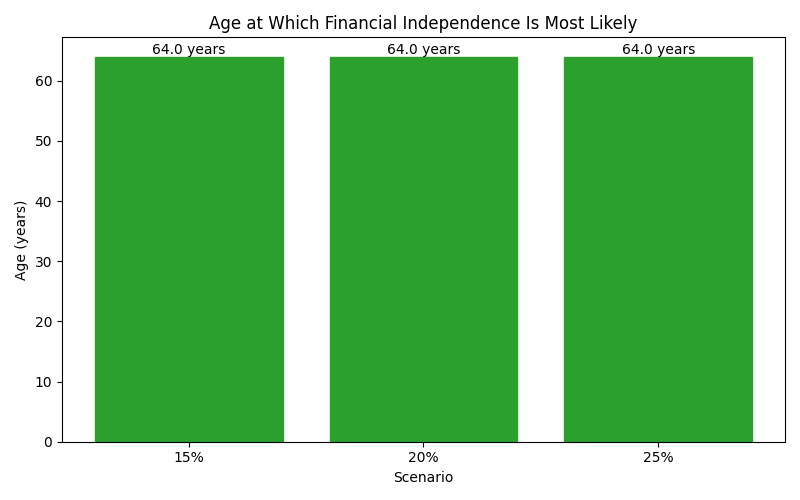
| 15% | 190,722 | 129,195 | 271,725 | 0% | 64 |
| 20% | 254,305 | 174,290 | 358,712 | 1% | 64 |
| 25% | 310,977 | 214,909 | 434,748 | 8% | 64 |
These charts show how each scenario affects long-term outcomes, including expected wealth, downside risk, and the likelihood of achieving financial independence.