Varied parameter
Income tax rate
0% → 30%
Software engineer in Hamburg · Independent and uneven
This page compares financial outcomes for a Software engineer living in Hamburg, Germany, following the Independent and uneven life scenario.
A non-linear income path shaped by project-based work, variability, and self-managed risk. Flexibility is high, but consistency must be actively created rather than assumed.
Hamburg has a strong professional services and logistics economy, with above-average costs and solid income potential.
The comparison focuses on how changing the Income tax rate influences long-term results, while all other assumptions remain constant.
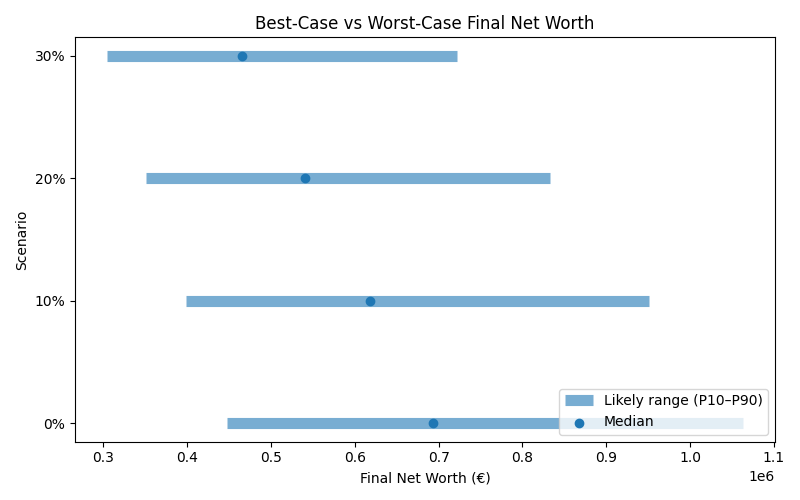
Results are shown as a realistic range. P10 represents a pessimistic outcome, while P90 represents an optimistic outcome. Most simulations fall between these two values.
| Scenario | Median Net Worth | P10 Net Worth | P90 Net Worth | FI Probability | FI Median Age |
|---|---|---|---|---|---|
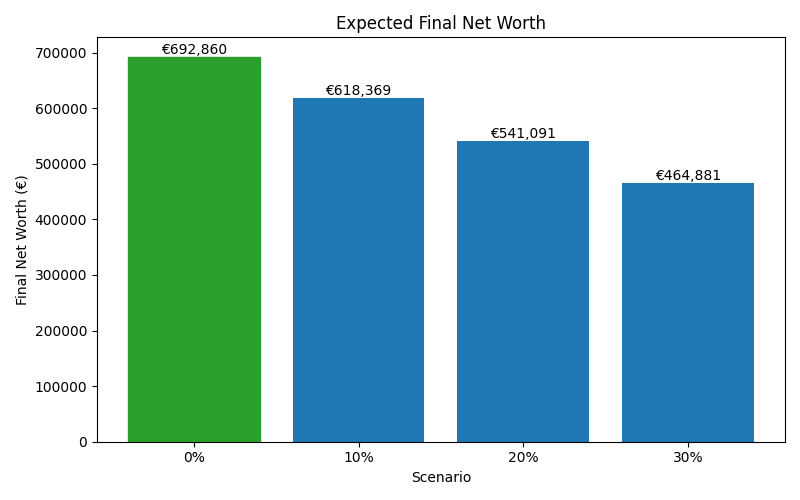
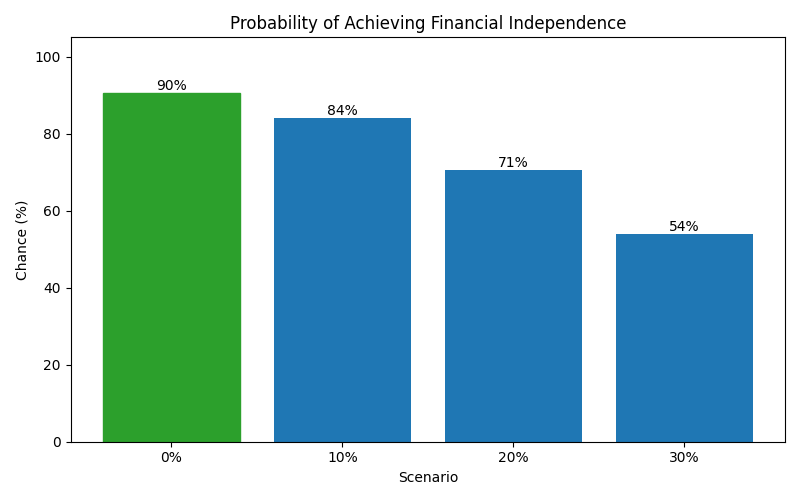
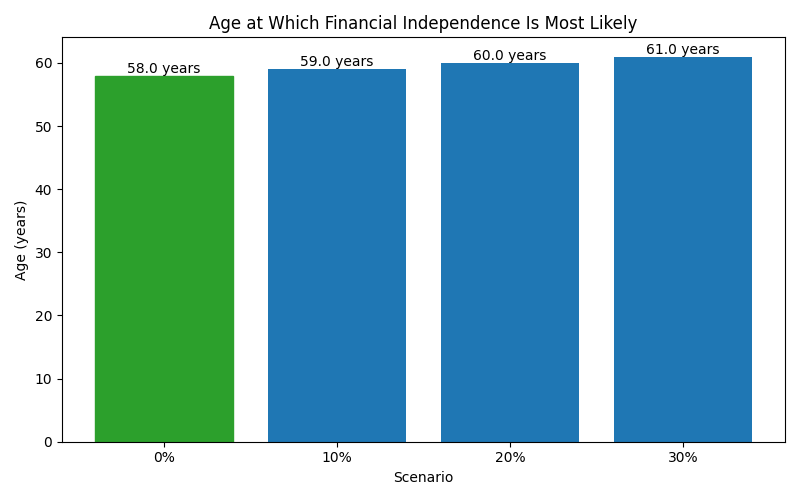
| 0% | 692,860 | 447,016 | 1,063,443 | 90% | 58 |
| 10% | 618,369 | 398,752 | 950,515 | 84% | 59 |
| 20% | 541,091 | 350,787 | 832,894 | 71% | 60 |
| 30% | 464,881 | 304,002 | 721,454 | 54% | 61 |
These charts show how each scenario affects long-term outcomes, including expected wealth, downside risk, and the likelihood of achieving financial independence.