Varied parameter
Saving rate
5% → 25%
Software engineer in Hamburg · Independent and uneven
This page compares financial outcomes for a Software engineer living in Hamburg, Germany, following the Independent and uneven life scenario.
A non-linear income path shaped by project-based work, variability, and self-managed risk. Flexibility is high, but consistency must be actively created rather than assumed.
Hamburg has a strong professional services and logistics economy, with above-average costs and solid income potential.
The comparison focuses on how changing the Saving rate influences long-term results, while all other assumptions remain constant.
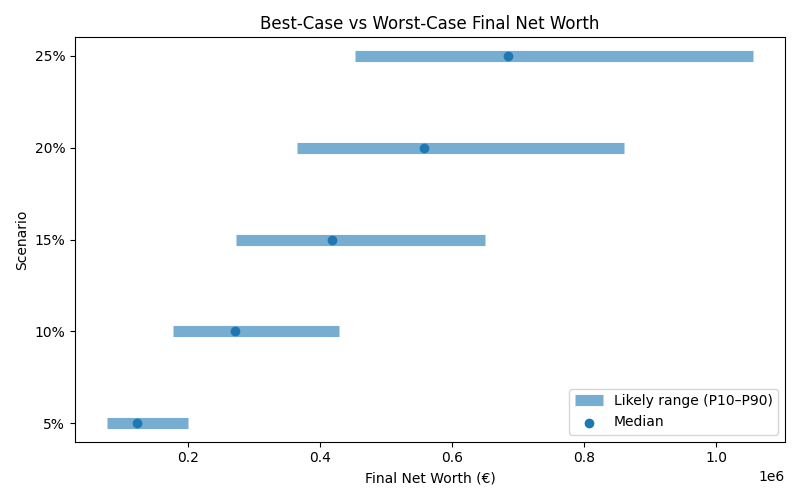
Results are shown as a realistic range. P10 represents a pessimistic outcome, while P90 represents an optimistic outcome. Most simulations fall between these two values.
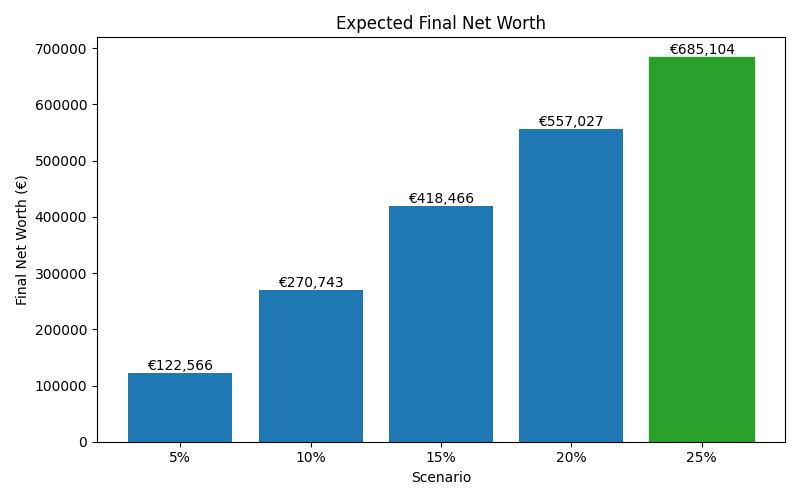
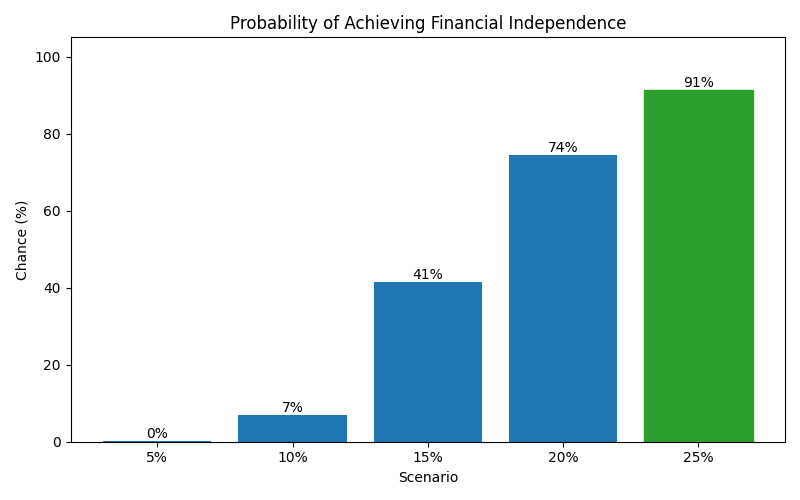
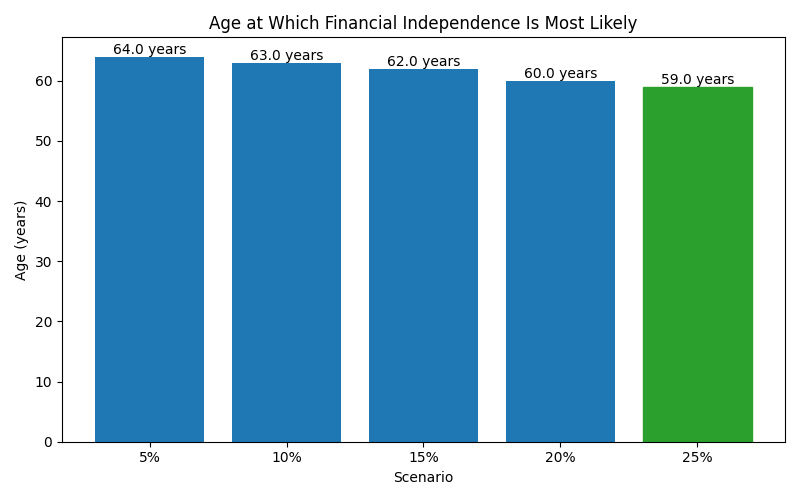
| Scenario | Median Net Worth | P10 Net Worth | P90 Net Worth | FI Probability | FI Median Age |
|---|---|---|---|---|---|
| 5% | 122,566 | 77,755 | 200,394 | 0% | 64 |
| 10% | 270,743 | 177,967 | 428,153 | 7% | 63 |
| 15% | 418,466 | 273,015 | 649,647 | 41% | 62 |
| 20% | 557,027 | 365,638 | 859,719 | 74% | 60 |
| 25% | 685,104 | 452,298 | 1,054,846 | 91% | 59 |
These charts show how each scenario affects long-term outcomes, including expected wealth, downside risk, and the likelihood of achieving financial independence.