Varied parameter
Income tax rate
0% → 30%
Software engineer in Hamburg · Fast-track independence
This page compares financial outcomes for a Software engineer living in Hamburg, Germany, following the Fast-track independence life scenario.
A high-intensity saving and investing strategy aimed at reaching financial independence as early as possible. Strong outcomes require discipline, sacrifice, and tolerance for market risk.
Hamburg has a strong professional services and logistics economy, with above-average costs and solid income potential.
The comparison focuses on how changing the Income tax rate influences long-term results, while all other assumptions remain constant.
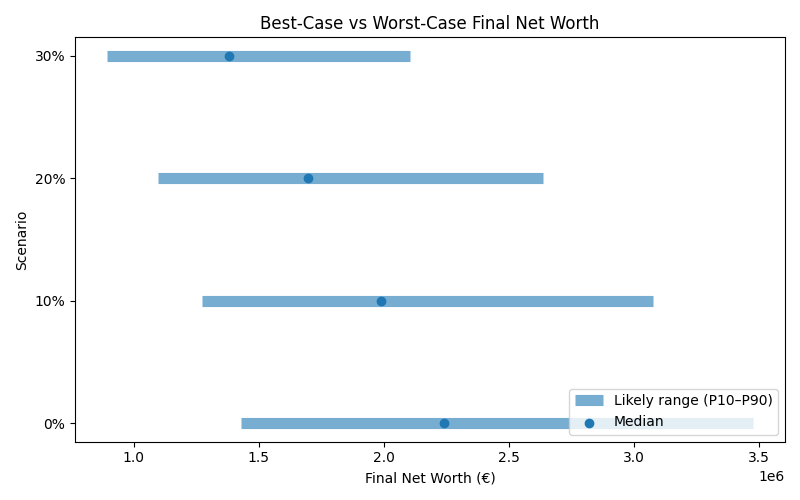
Results are shown as a realistic range. P10 represents a pessimistic outcome, while P90 represents an optimistic outcome. Most simulations fall between these two values.
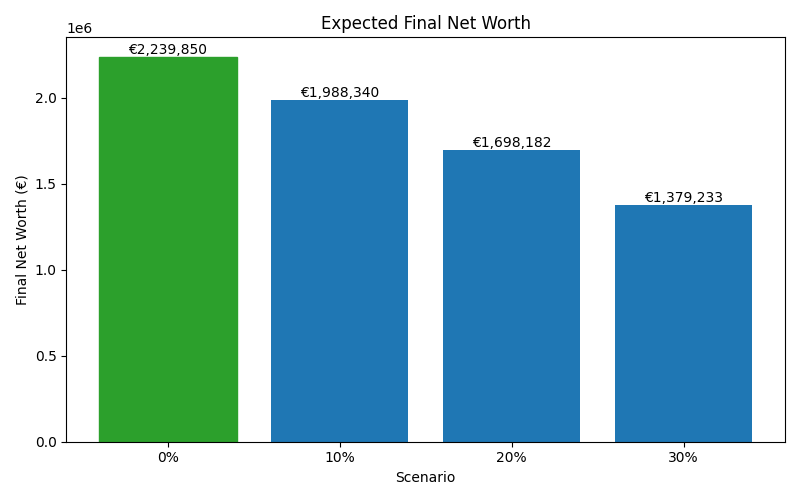
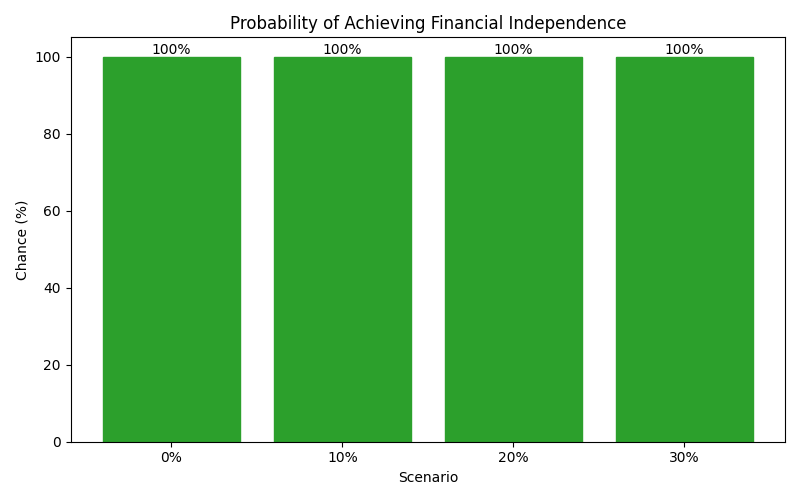
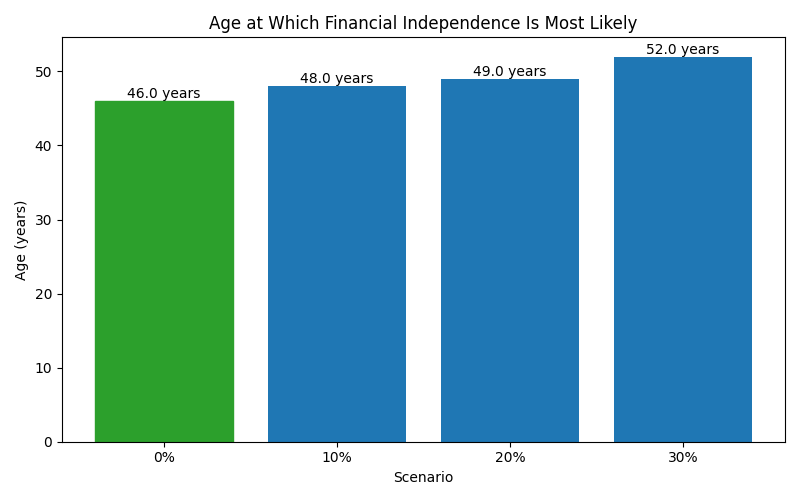
| Scenario | Median Net Worth | P10 Net Worth | P90 Net Worth | FI Probability | FI Median Age |
|---|---|---|---|---|---|
| 0% | 2,239,850 | 1,428,242 | 3,476,255 | 100% | 46 |
| 10% | 1,988,340 | 1,273,158 | 3,079,117 | 100% | 48 |
| 20% | 1,698,182 | 1,098,139 | 2,637,473 | 100% | 49 |
| 30% | 1,379,233 | 894,343 | 2,106,303 | 100% | 52 |
These charts show how each scenario affects long-term outcomes, including expected wealth, downside risk, and the likelihood of achieving financial independence.