Varied parameter
Income tax rate
0% → 30%
Software engineer in Berlin · A volatile financial ride
This page compares financial outcomes for a Software engineer living in Berlin, Germany, following the A volatile financial ride life scenario.
A highly unstable financial path combining income uncertainty, market swings, and repeated adverse events. Outcomes range widely, from recovery and growth to prolonged stagnation.
Berlin has a diverse economy with strong demand in technology and services, paired with a relatively high cost of living.
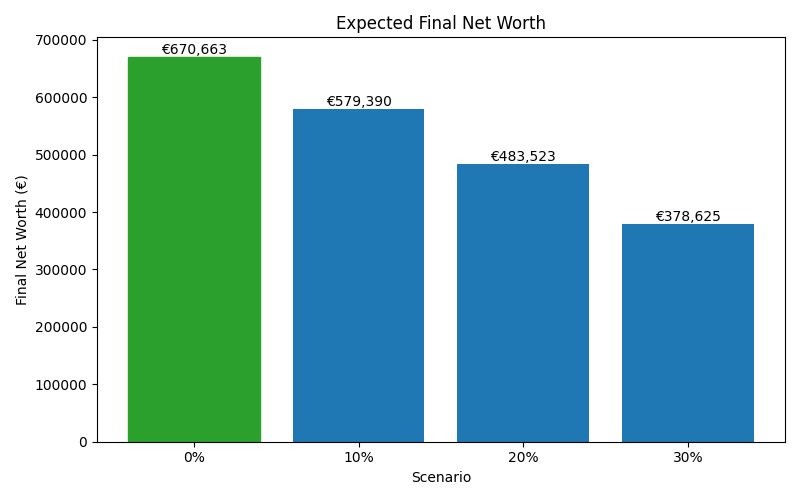
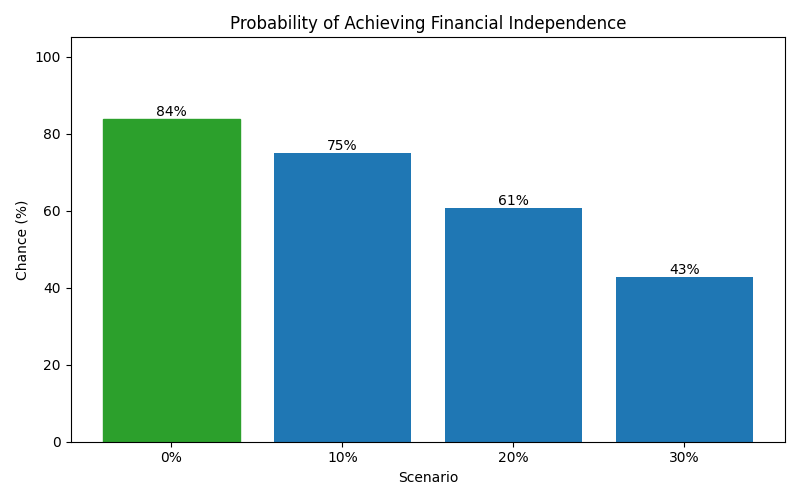
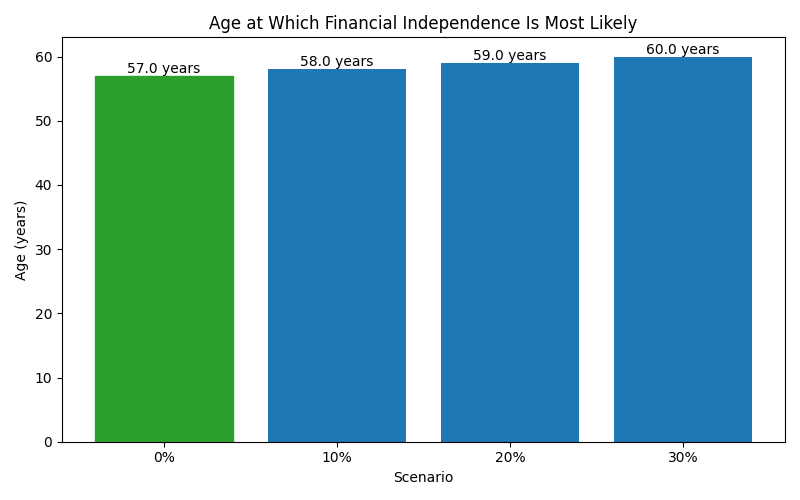
The comparison focuses on how changing the Income tax rate influences long-term results, while all other assumptions remain constant.
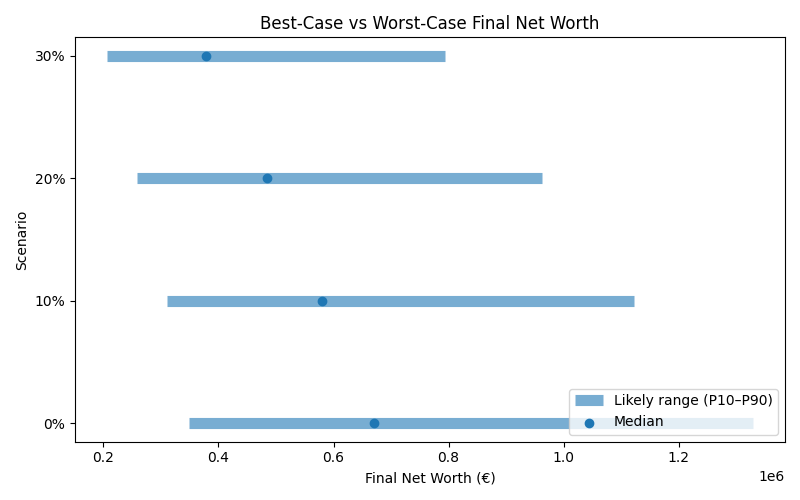
Results are shown as a realistic range. P10 represents a pessimistic outcome, while P90 represents an optimistic outcome. Most simulations fall between these two values.
| Scenario | Median Net Worth | P10 Net Worth | P90 Net Worth | FI Probability | FI Median Age |
|---|---|---|---|---|---|
| 0% | 670,663 | 348,864 | 1,328,609 | 84% | 57 |
| 10% | 579,390 | 309,870 | 1,121,741 | 75% | 58 |
| 20% | 483,523 | 258,174 | 962,480 | 61% | 59 |
| 30% | 378,625 | 206,823 | 793,983 | 43% | 60 |
These charts show how each scenario affects long-term outcomes, including expected wealth, downside risk, and the likelihood of achieving financial independence.