Varied parameter
Income tax rate
0% → 30%
Software engineer in Berlin · The steady builder
This page compares financial outcomes for a Software engineer living in Berlin, Germany, following the The steady builder life scenario.
A balanced financial life built on predictable income growth, consistent saving, and long-term market participation. Progress comes from patience, stability, and compounding over time.
Berlin has a diverse economy with strong demand in technology and services, paired with a relatively high cost of living.
The comparison focuses on how changing the Income tax rate influences long-term results, while all other assumptions remain constant.
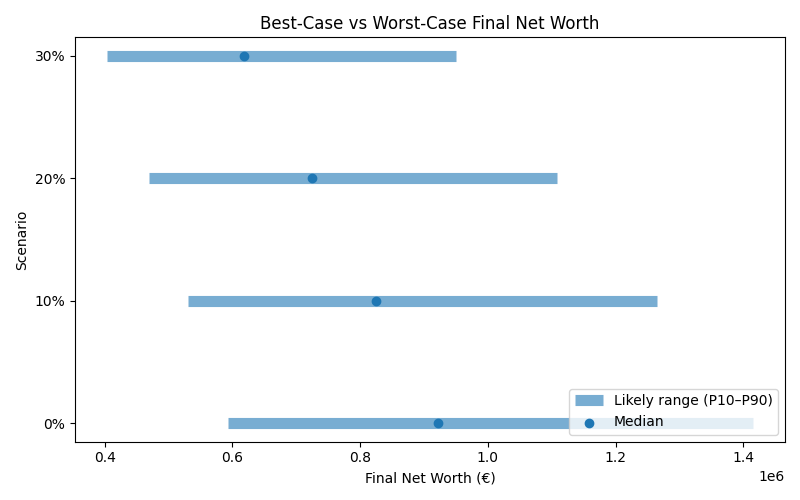
Results are shown as a realistic range. P10 represents a pessimistic outcome, while P90 represents an optimistic outcome. Most simulations fall between these two values.
| Scenario | Median Net Worth | P10 Net Worth | P90 Net Worth | FI Probability | FI Median Age |
|---|---|---|---|---|---|
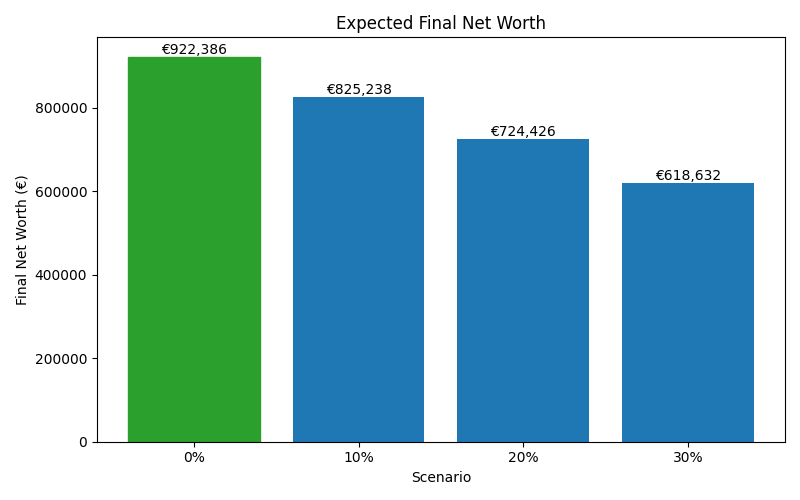
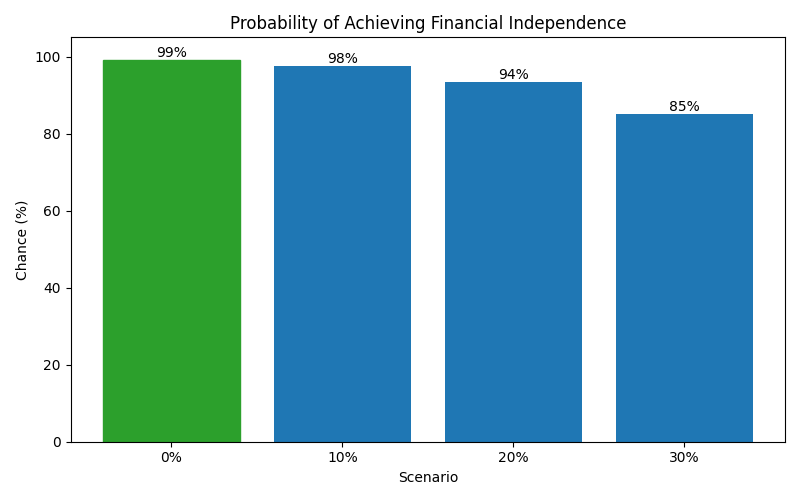
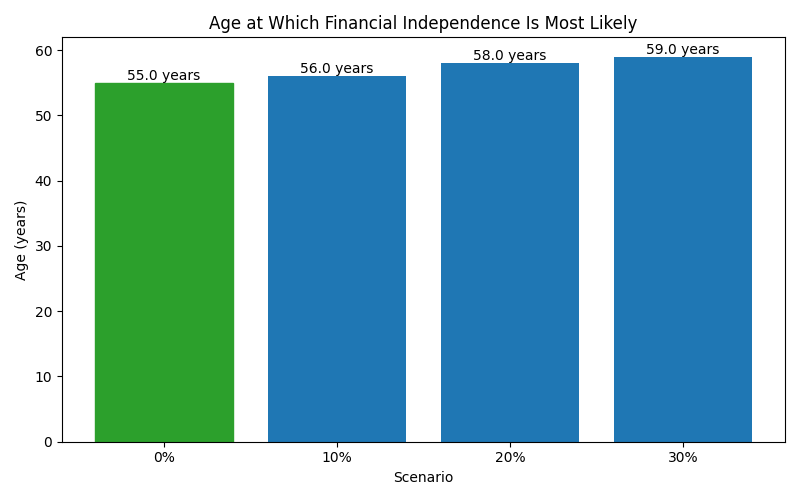
| 0% | 922,386 | 593,860 | 1,414,544 | 99% | 55 |
| 10% | 825,238 | 530,957 | 1,264,124 | 98% | 56 |
| 20% | 724,426 | 469,274 | 1,108,734 | 94% | 58 |
| 30% | 618,632 | 404,158 | 950,457 | 85% | 59 |
These charts show how each scenario affects long-term outcomes, including expected wealth, downside risk, and the likelihood of achieving financial independence.