Varied parameter
Income tax rate
0% → 30%
Software engineer in Berlin · Starting late
This page compares financial outcomes for a Software engineer living in Berlin, Germany, following the Starting late life scenario.
A financial life that begins later, leaving fewer years for compounding to work. Success relies on disciplined saving, steady income, and sustained focus over a shorter horizon.
Berlin has a diverse economy with strong demand in technology and services, paired with a relatively high cost of living.
The comparison focuses on how changing the Income tax rate influences long-term results, while all other assumptions remain constant.
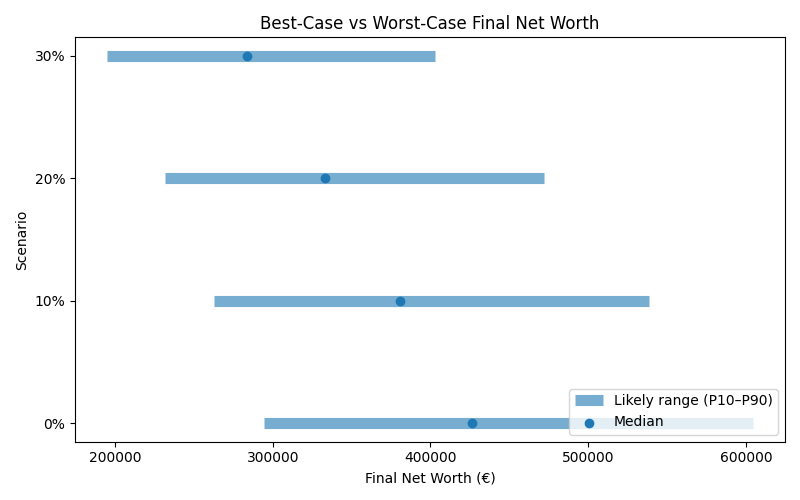
Results are shown as a realistic range. P10 represents a pessimistic outcome, while P90 represents an optimistic outcome. Most simulations fall between these two values.
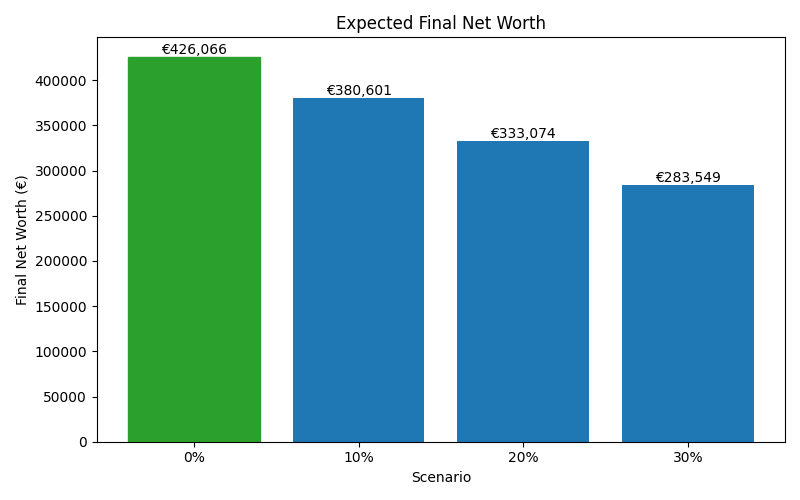
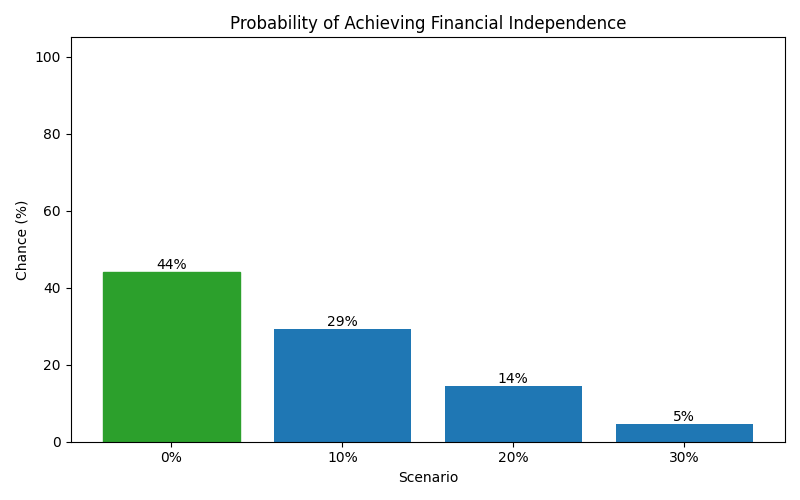
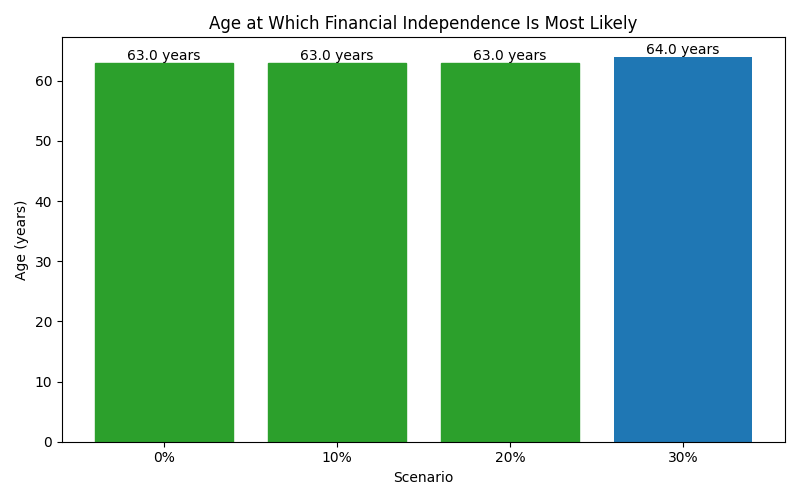
| Scenario | Median Net Worth | P10 Net Worth | P90 Net Worth | FI Probability | FI Median Age |
|---|---|---|---|---|---|
| 0% | 426,066 | 294,621 | 604,379 | 44% | 63 |
| 10% | 380,601 | 263,027 | 538,891 | 29% | 63 |
| 20% | 333,074 | 231,765 | 471,889 | 14% | 63 |
| 30% | 283,549 | 195,123 | 402,734 | 5% | 64 |
These charts show how each scenario affects long-term outcomes, including expected wealth, downside risk, and the likelihood of achieving financial independence.