Varied parameter
Saving rate
5% → 25%
Software engineer in Berlin · Starting late
This page compares financial outcomes for a Software engineer living in Berlin, Germany, following the Starting late life scenario.
A financial life that begins later, leaving fewer years for compounding to work. Success relies on disciplined saving, steady income, and sustained focus over a shorter horizon.
Berlin has a diverse economy with strong demand in technology and services, paired with a relatively high cost of living.
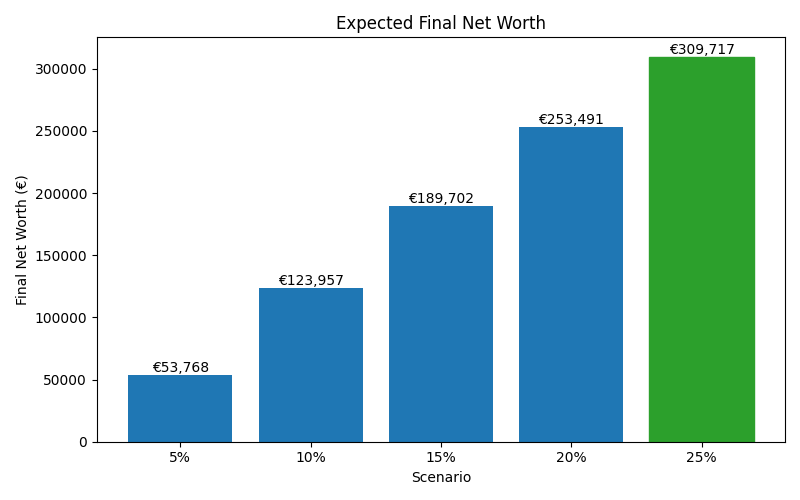
The comparison focuses on how changing the Saving rate influences long-term results, while all other assumptions remain constant.
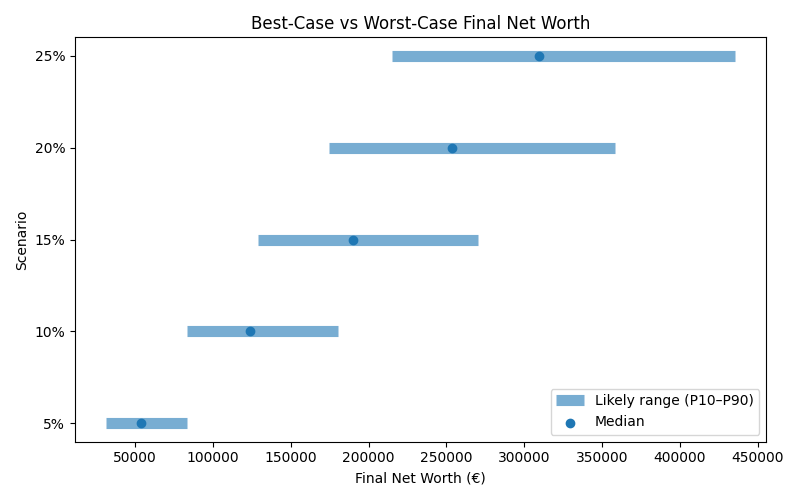
Results are shown as a realistic range. P10 represents a pessimistic outcome, while P90 represents an optimistic outcome. Most simulations fall between these two values.
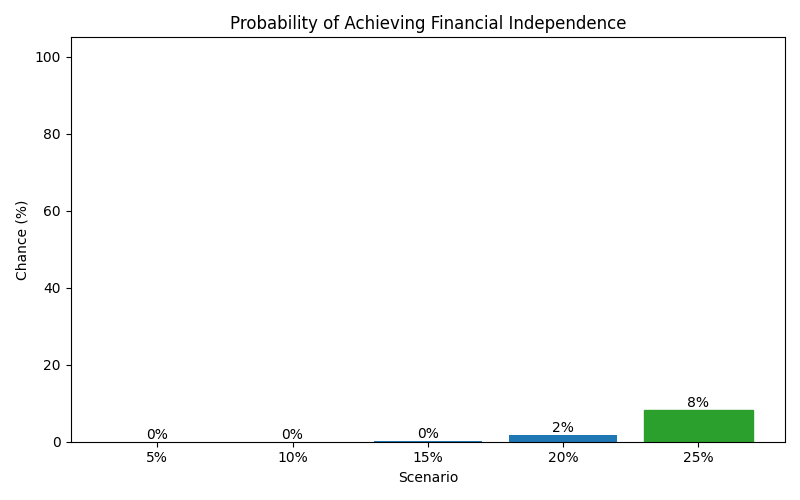
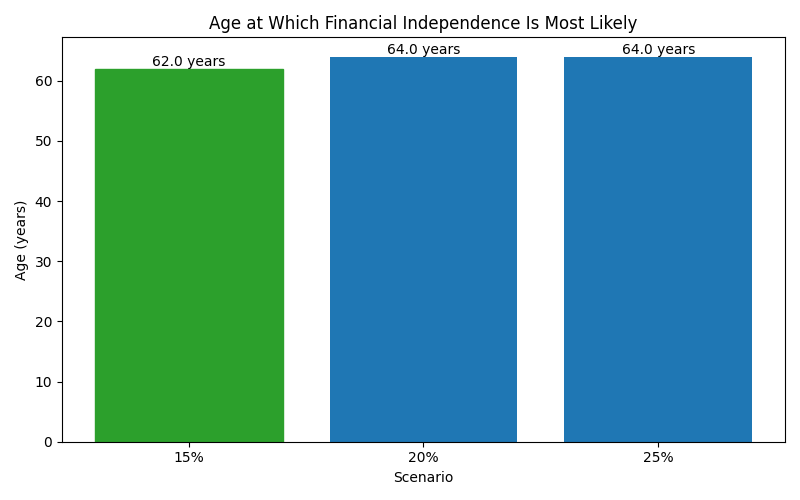
| Scenario | Median Net Worth | P10 Net Worth | P90 Net Worth | FI Probability | FI Median Age |
|---|---|---|---|---|---|
| 5% | 53,768 | 31,642 | 83,307 | 0% | — |
| 10% | 123,957 | 83,300 | 180,130 | 0% | — |
| 15% | 189,702 | 128,889 | 270,523 | 0% | 62 |
| 20% | 253,491 | 174,327 | 358,015 | 2% | 64 |
| 25% | 309,717 | 215,162 | 435,305 | 8% | 64 |
These charts show how each scenario affects long-term outcomes, including expected wealth, downside risk, and the likelihood of achieving financial independence.