Varied parameter
Income tax rate
0% → 30%
Software engineer in Berlin · Peak earning years
This page compares financial outcomes for a Software engineer living in Berlin, Germany, following the Peak earning years life scenario.
A high-income trajectory with strong saving capacity and rapid wealth accumulation. Compounding works faster here, but results remain exposed to market cycles and timing.
Berlin has a diverse economy with strong demand in technology and services, paired with a relatively high cost of living.
The comparison focuses on how changing the Income tax rate influences long-term results, while all other assumptions remain constant.
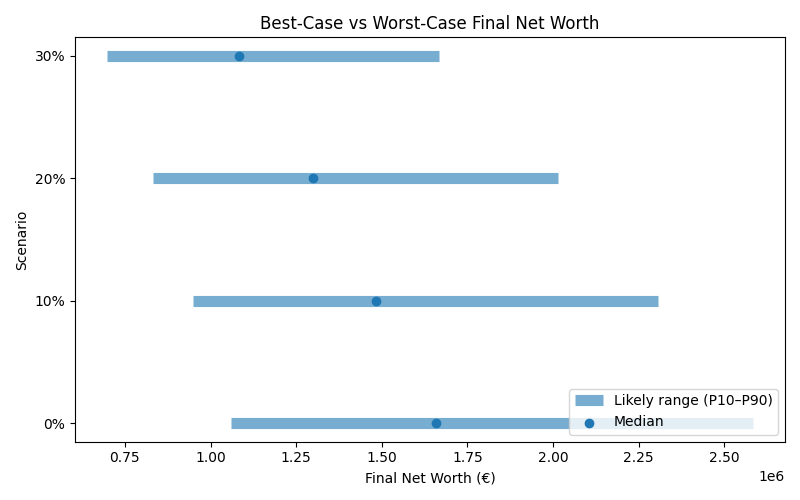
Results are shown as a realistic range. P10 represents a pessimistic outcome, while P90 represents an optimistic outcome. Most simulations fall between these two values.
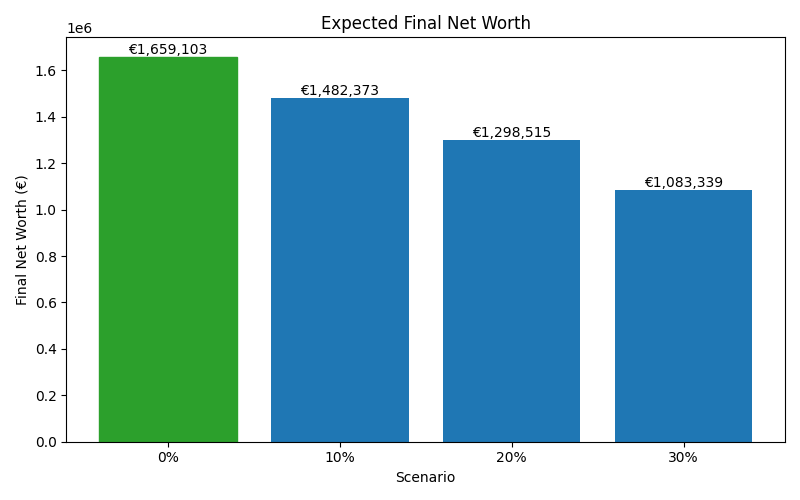
| Scenario | Median Net Worth | P10 Net Worth | P90 Net Worth | FI Probability | FI Median Age |
|---|---|---|---|---|---|
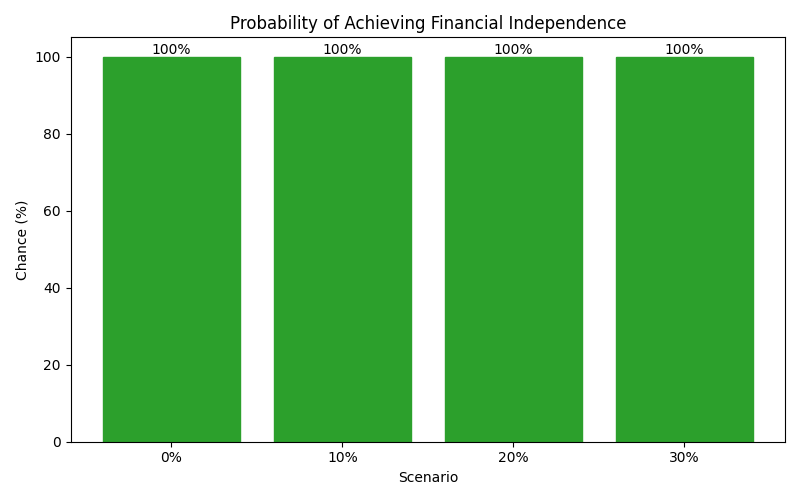
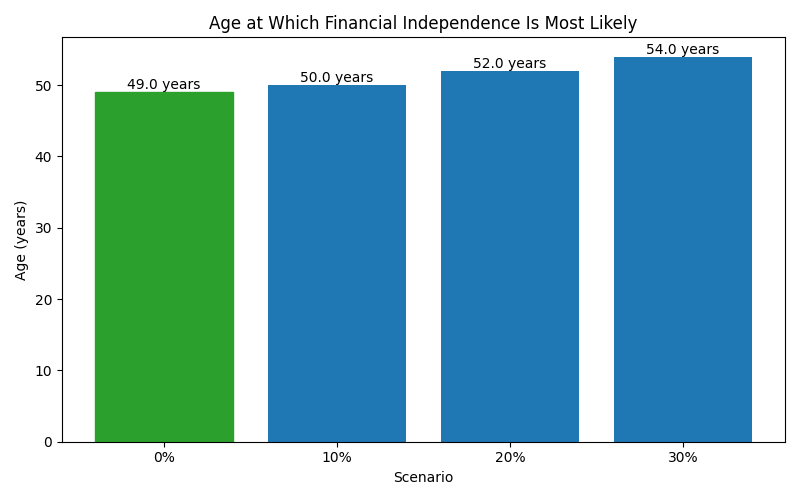
| 0% | 1,659,103 | 1,060,089 | 2,582,707 | 100% | 49 |
| 10% | 1,482,373 | 947,601 | 2,306,181 | 100% | 50 |
| 20% | 1,298,515 | 833,087 | 2,015,442 | 100% | 52 |
| 30% | 1,083,339 | 698,604 | 1,667,408 | 100% | 54 |
These charts show how each scenario affects long-term outcomes, including expected wealth, downside risk, and the likelihood of achieving financial independence.