Varied parameter
Income tax rate
0% → 30%
Software engineer in Berlin · Independent and uneven
This page compares financial outcomes for a Software engineer living in Berlin, Germany, following the Independent and uneven life scenario.
A non-linear income path shaped by project-based work, variability, and self-managed risk. Flexibility is high, but consistency must be actively created rather than assumed.
Berlin has a diverse economy with strong demand in technology and services, paired with a relatively high cost of living.
The comparison focuses on how changing the Income tax rate influences long-term results, while all other assumptions remain constant.
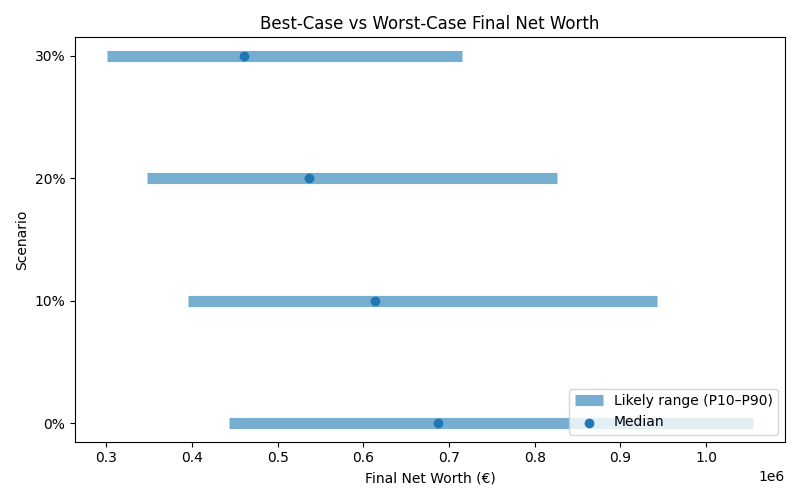
Results are shown as a realistic range. P10 represents a pessimistic outcome, while P90 represents an optimistic outcome. Most simulations fall between these two values.
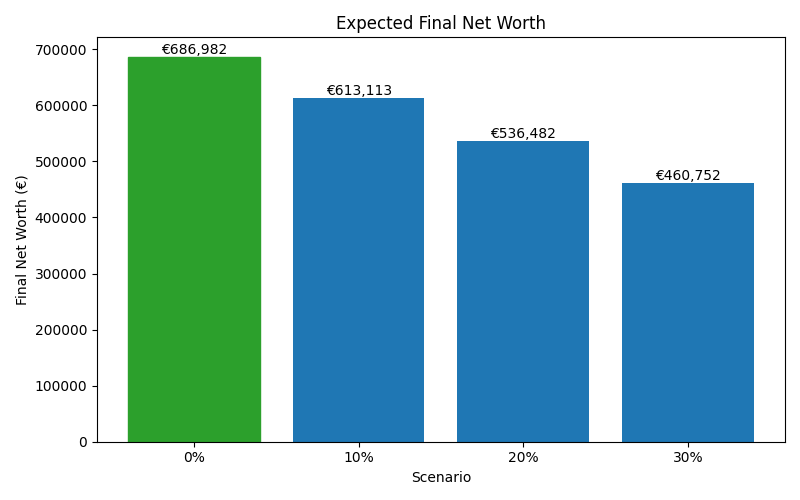
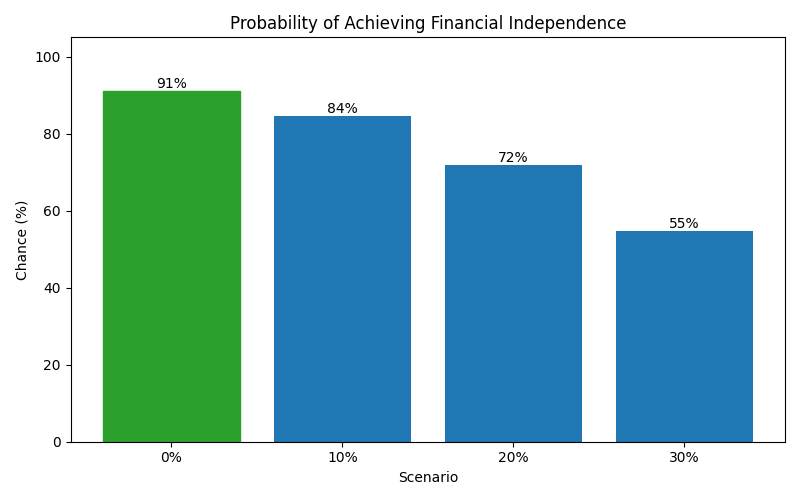
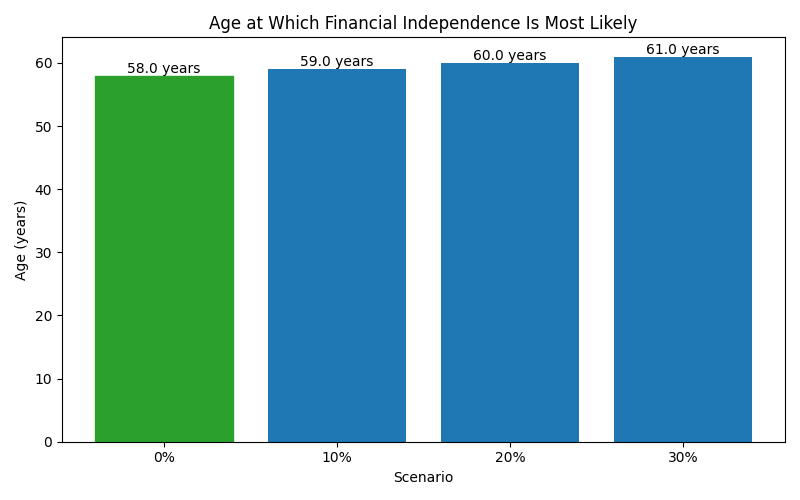
| Scenario | Median Net Worth | P10 Net Worth | P90 Net Worth | FI Probability | FI Median Age |
|---|---|---|---|---|---|
| 0% | 686,982 | 443,359 | 1,054,502 | 91% | 58 |
| 10% | 613,113 | 395,193 | 942,226 | 84% | 59 |
| 20% | 536,482 | 347,598 | 826,027 | 72% | 60 |
| 30% | 460,752 | 301,098 | 715,602 | 55% | 61 |
These charts show how each scenario affects long-term outcomes, including expected wealth, downside risk, and the likelihood of achieving financial independence.