Varied parameter
Saving rate
5% → 25%
Software engineer in Berlin · Independent and uneven
This page compares financial outcomes for a Software engineer living in Berlin, Germany, following the Independent and uneven life scenario.
A non-linear income path shaped by project-based work, variability, and self-managed risk. Flexibility is high, but consistency must be actively created rather than assumed.
Berlin has a diverse economy with strong demand in technology and services, paired with a relatively high cost of living.
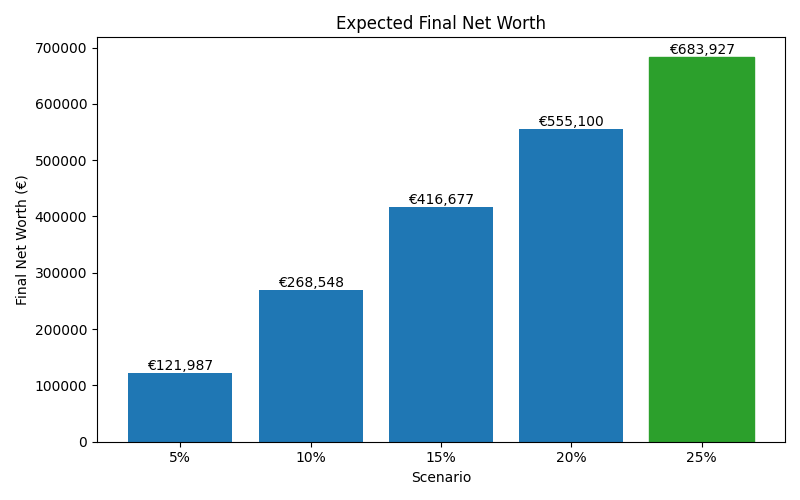
The comparison focuses on how changing the Saving rate influences long-term results, while all other assumptions remain constant.
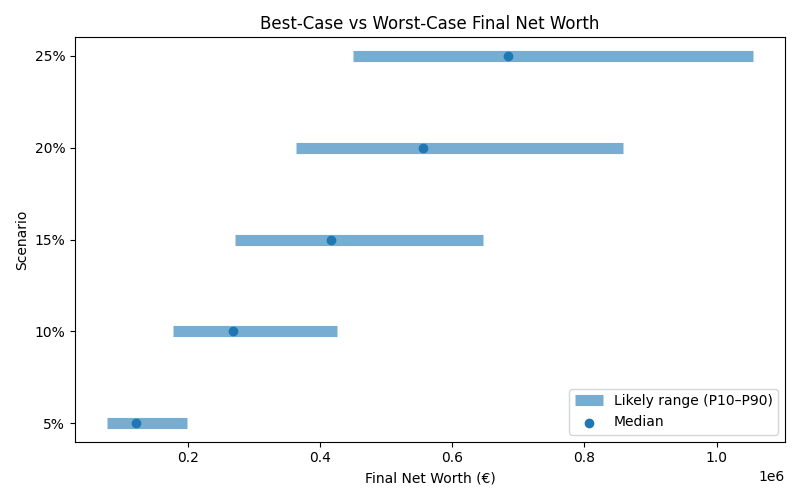
Results are shown as a realistic range. P10 represents a pessimistic outcome, while P90 represents an optimistic outcome. Most simulations fall between these two values.
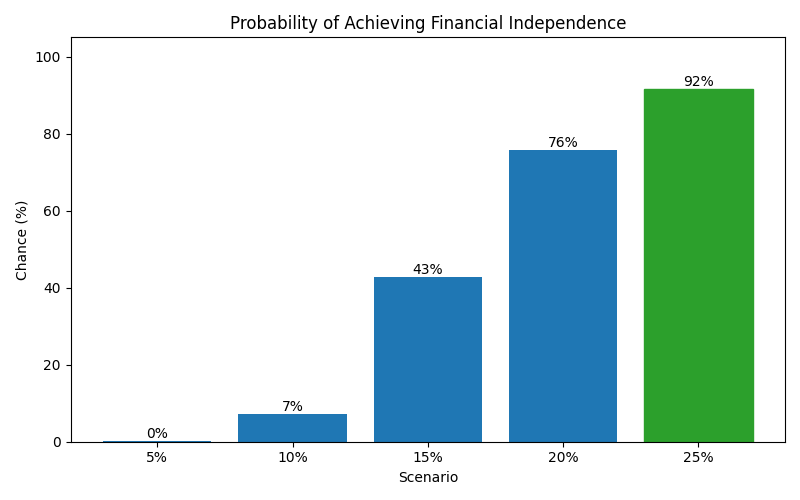
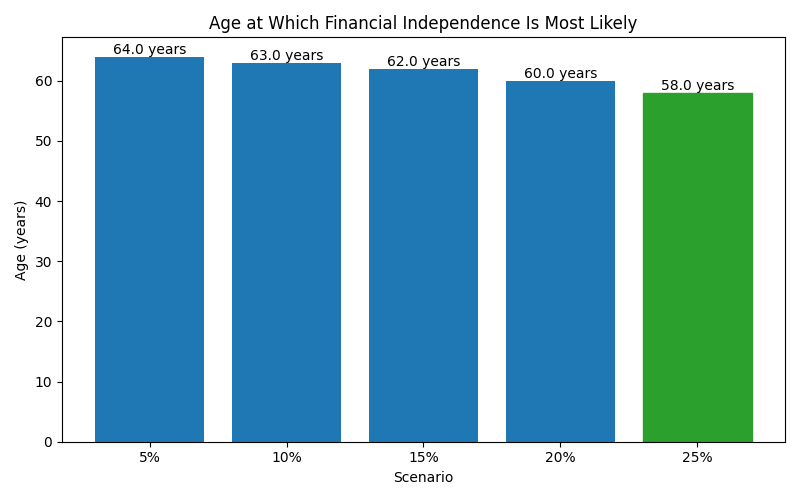
| Scenario | Median Net Worth | P10 Net Worth | P90 Net Worth | FI Probability | FI Median Age |
|---|---|---|---|---|---|
| 5% | 121,987 | 78,072 | 198,976 | 0% | 64 |
| 10% | 268,548 | 176,845 | 425,543 | 7% | 63 |
| 15% | 416,677 | 271,531 | 646,441 | 43% | 62 |
| 20% | 555,100 | 363,912 | 858,789 | 76% | 60 |
| 25% | 683,927 | 450,128 | 1,054,637 | 92% | 58 |
These charts show how each scenario affects long-term outcomes, including expected wealth, downside risk, and the likelihood of achieving financial independence.