Varied parameter
Income tax rate
0% → 30%
Software engineer in Berlin · Fast-track independence
This page compares financial outcomes for a Software engineer living in Berlin, Germany, following the Fast-track independence life scenario.
A high-intensity saving and investing strategy aimed at reaching financial independence as early as possible. Strong outcomes require discipline, sacrifice, and tolerance for market risk.
Berlin has a diverse economy with strong demand in technology and services, paired with a relatively high cost of living.
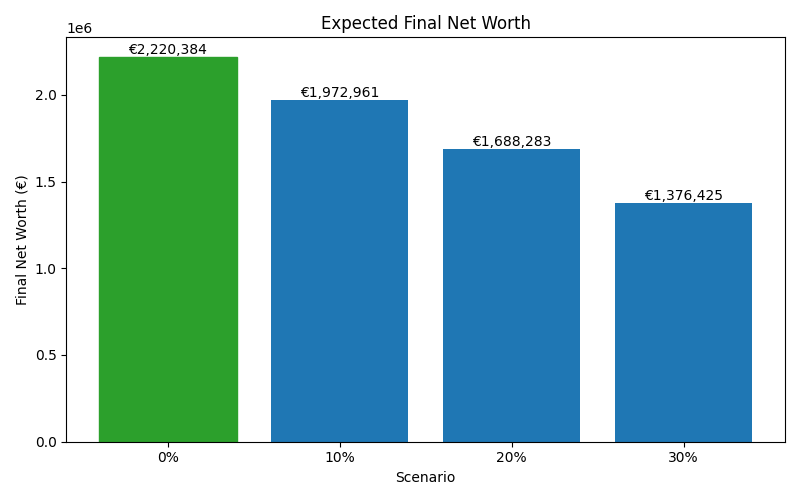
The comparison focuses on how changing the Income tax rate influences long-term results, while all other assumptions remain constant.
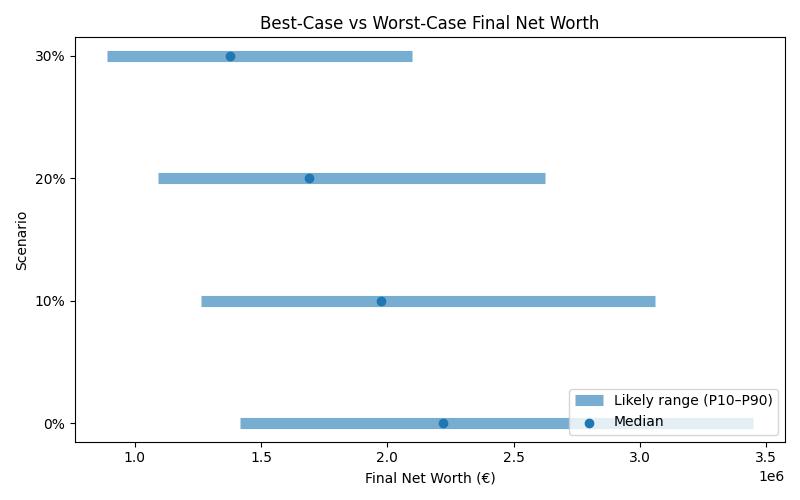
Results are shown as a realistic range. P10 represents a pessimistic outcome, while P90 represents an optimistic outcome. Most simulations fall between these two values.
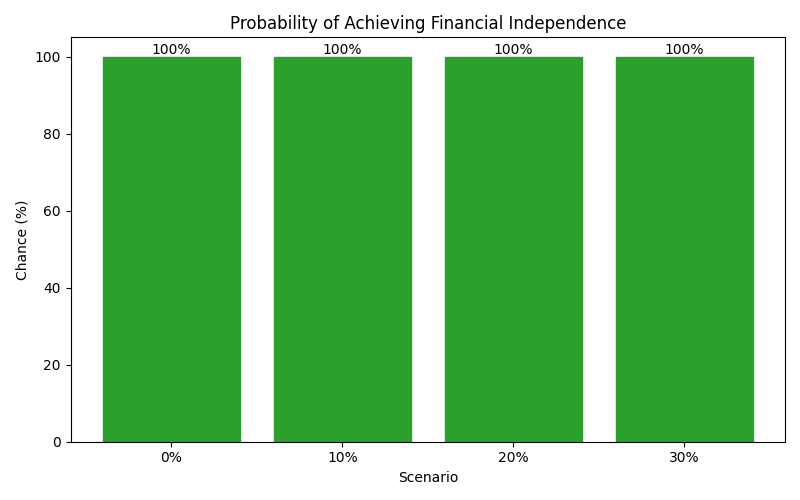
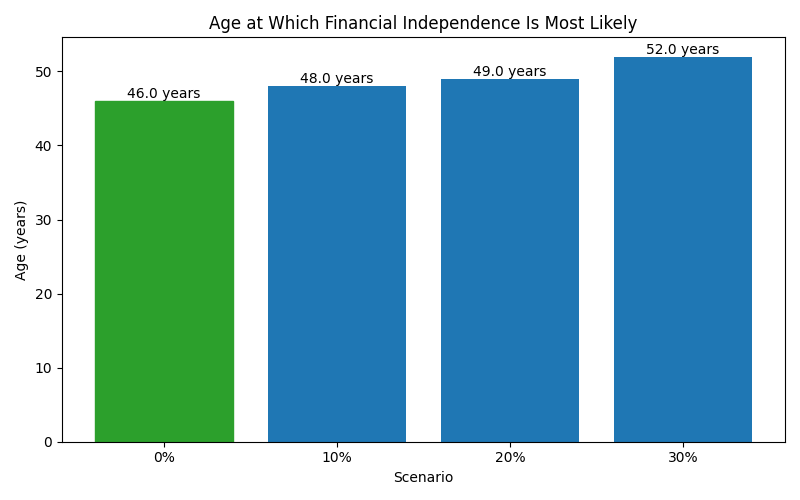
| Scenario | Median Net Worth | P10 Net Worth | P90 Net Worth | FI Probability | FI Median Age |
|---|---|---|---|---|---|
| 0% | 2,220,384 | 1,415,403 | 3,446,473 | 100% | 46 |
| 10% | 1,972,961 | 1,263,721 | 3,057,624 | 100% | 48 |
| 20% | 1,688,283 | 1,090,247 | 2,623,843 | 100% | 49 |
| 30% | 1,376,425 | 891,225 | 2,099,157 | 100% | 52 |
These charts show how each scenario affects long-term outcomes, including expected wealth, downside risk, and the likelihood of achieving financial independence.