Varied parameter
Saving rate
5% → 25%
Software engineer in Berlin · Fast-track independence
This page compares financial outcomes for a Software engineer living in Berlin, Germany, following the Fast-track independence life scenario.
A high-intensity saving and investing strategy aimed at reaching financial independence as early as possible. Strong outcomes require discipline, sacrifice, and tolerance for market risk.
Berlin has a diverse economy with strong demand in technology and services, paired with a relatively high cost of living.
The comparison focuses on how changing the Saving rate influences long-term results, while all other assumptions remain constant.
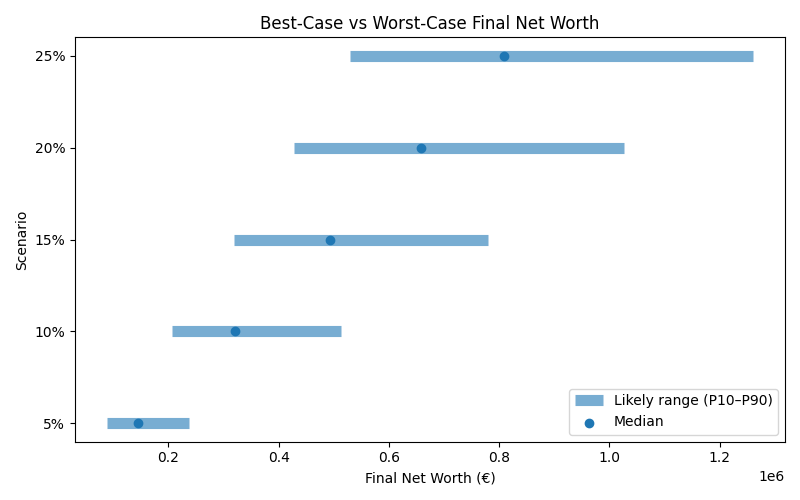
Results are shown as a realistic range. P10 represents a pessimistic outcome, while P90 represents an optimistic outcome. Most simulations fall between these two values.
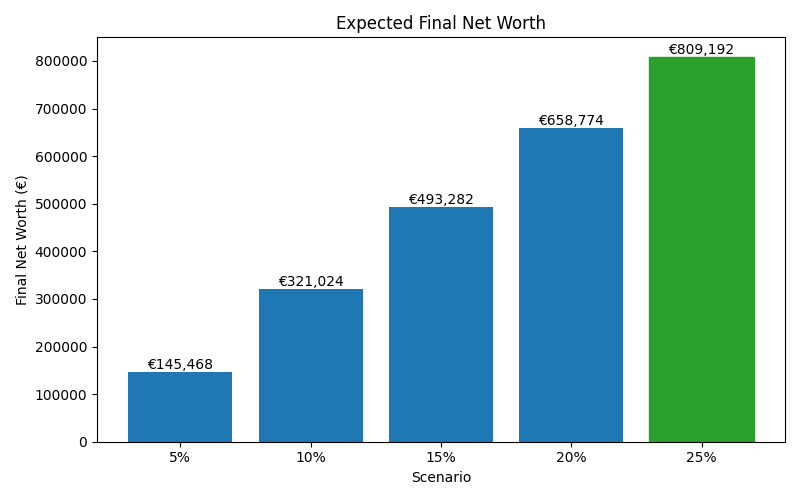
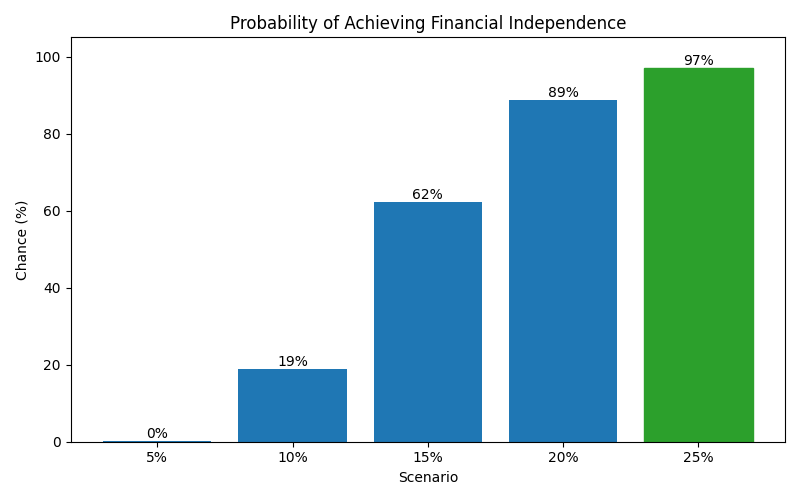
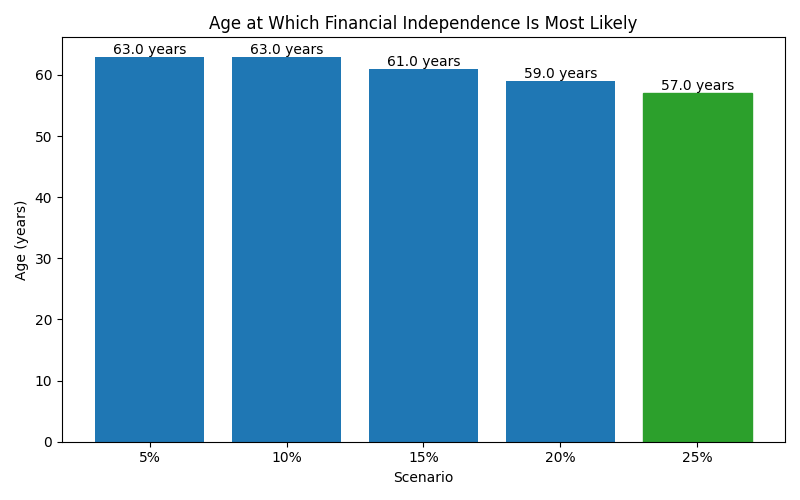
| Scenario | Median Net Worth | P10 Net Worth | P90 Net Worth | FI Probability | FI Median Age |
|---|---|---|---|---|---|
| 5% | 145,468 | 89,343 | 237,176 | 0% | 63 |
| 10% | 321,024 | 207,486 | 512,403 | 19% | 63 |
| 15% | 493,282 | 319,385 | 779,622 | 62% | 61 |
| 20% | 658,774 | 428,065 | 1,025,747 | 89% | 59 |
| 25% | 809,192 | 530,150 | 1,259,965 | 97% | 57 |
These charts show how each scenario affects long-term outcomes, including expected wealth, downside risk, and the likelihood of achieving financial independence.