Varied parameter
Income tax rate
0% → 30%
Retail worker in Madrid · Living on thin margins
This page compares financial outcomes for a Retail worker living in Madrid, Spain, following the Living on thin margins life scenario.
A financial path with limited room for error, where small shocks can have outsized effects. Long-term outcomes depend more on resilience, adaptability, and avoiding major setbacks.
Madrid concentrates many higher-paying roles and business opportunities, with a correspondingly higher urban cost structure.
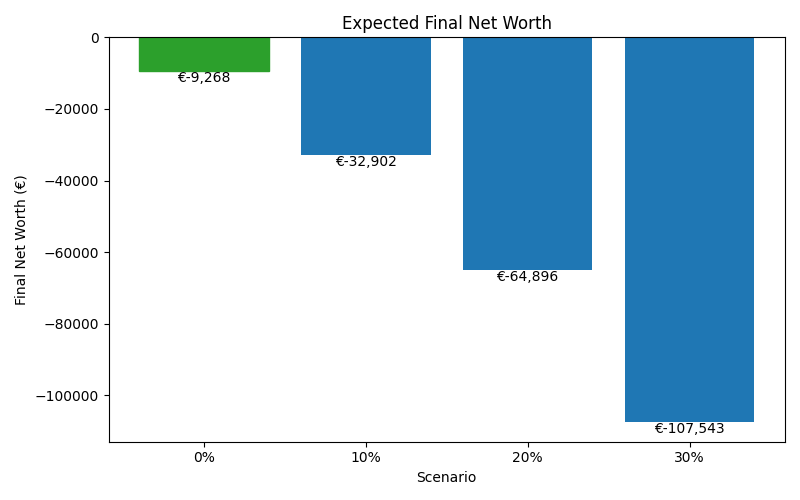
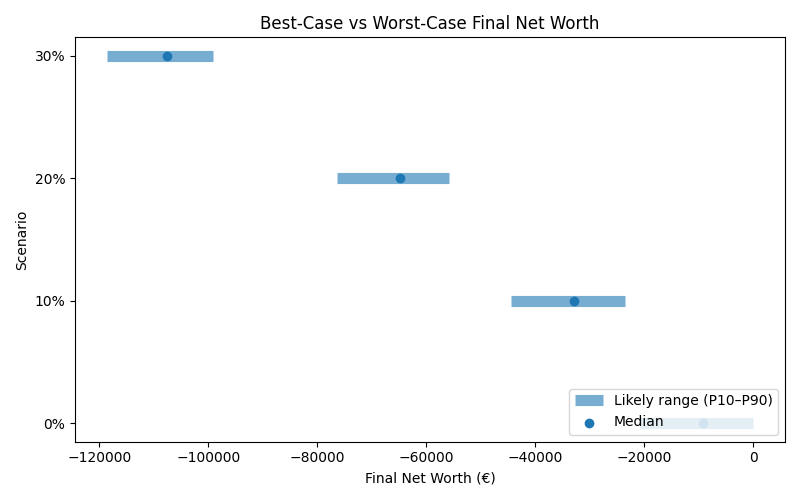
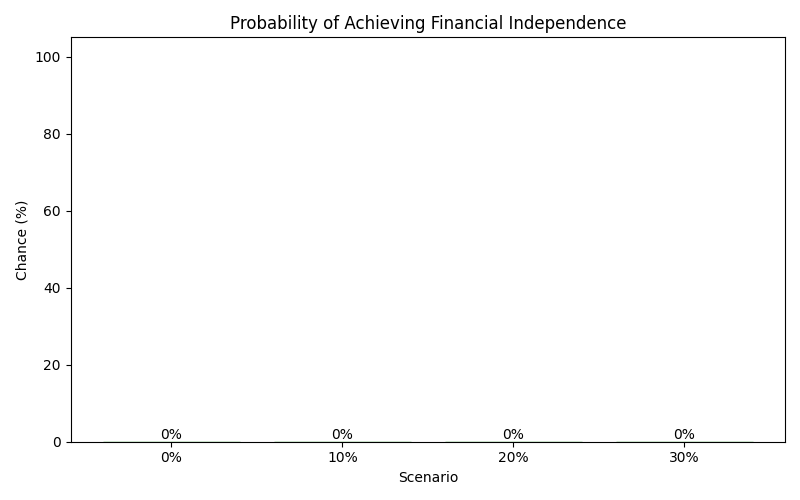
The comparison focuses on how changing the Income tax rate influences long-term results, while all other assumptions remain constant.
Results are shown as a realistic range. P10 represents a pessimistic outcome, while P90 represents an optimistic outcome. Most simulations fall between these two values.
| Scenario | Median Net Worth | P10 Net Worth | P90 Net Worth | FI Probability | FI Median Age |
|---|---|---|---|---|---|
| 0% | -9,268 | -20,752 | -85 | 0% | — |
| 10% | -32,902 | -44,455 | -23,499 | 0% | — |
| 20% | -64,896 | -76,450 | -55,741 | 0% | — |
| 30% | -107,543 | -118,511 | -99,133 | 0% | — |
These charts show how each scenario affects long-term outcomes, including expected wealth, downside risk, and the likelihood of achieving financial independence.