Varied parameter
Income tax rate
0% → 30%
Retail worker in Barcelona · Family-first life
This page compares financial outcomes for a Retail worker living in Barcelona, Spain, following the Family-first life life scenario.
A financial path shaped by long-term household responsibilities and shared priorities. Progress trades flexibility for stability, planning, and collective decision-making.
Barcelona combines a broad service and tech market with elevated living costs relative to the Spanish national average.
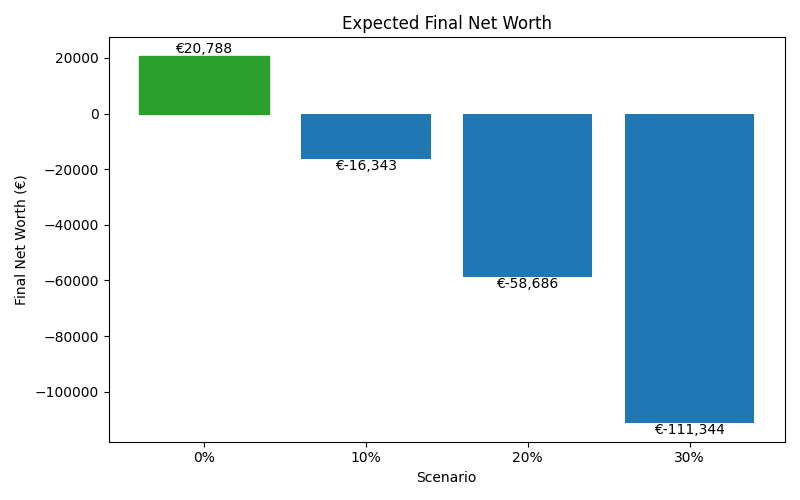
The comparison focuses on how changing the Income tax rate influences long-term results, while all other assumptions remain constant.
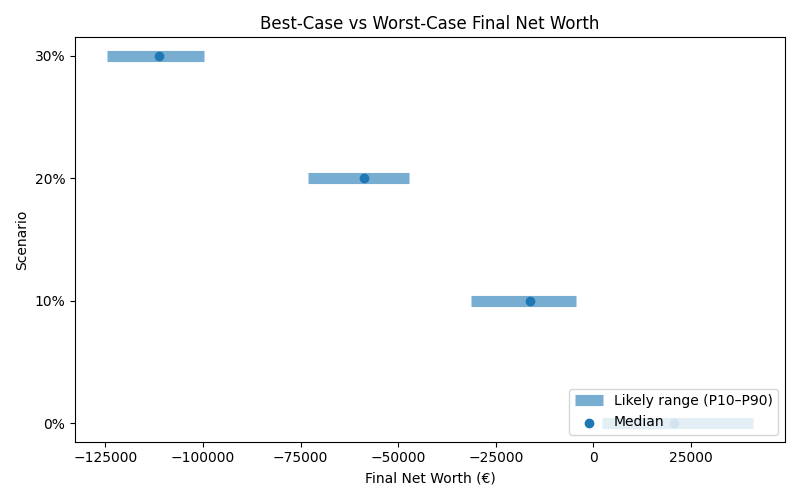
Results are shown as a realistic range. P10 represents a pessimistic outcome, while P90 represents an optimistic outcome. Most simulations fall between these two values.
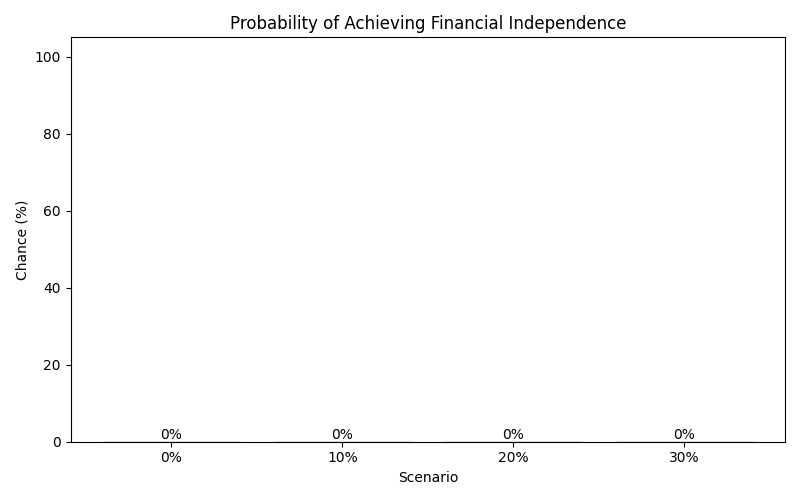
| Scenario | Median Net Worth | P10 Net Worth | P90 Net Worth | FI Probability | FI Median Age |
|---|---|---|---|---|---|
| 0% | 20,788 | 2,108 | 40,851 | 0% | — |
| 10% | -16,343 | -31,265 | -4,353 | 0% | — |
| 20% | -58,686 | -73,003 | -47,181 | 0% | — |
| 30% | -111,344 | -124,526 | -99,855 | 0% | — |
These charts show how each scenario affects long-term outcomes, including expected wealth, downside risk, and the likelihood of achieving financial independence.