Varied parameter
Income tax rate
0% → 30%
Retail worker in Bucharest · Family-first life
This page compares financial outcomes for a Retail worker living in Bucharest, Romania, following the Family-first life life scenario.
A financial path shaped by long-term household responsibilities and shared priorities. Progress trades flexibility for stability, planning, and collective decision-making.
Bucharest offers the highest income potential in Romania, along with higher living costs and more competitive job markets.
The comparison focuses on how changing the Income tax rate influences long-term results, while all other assumptions remain constant.
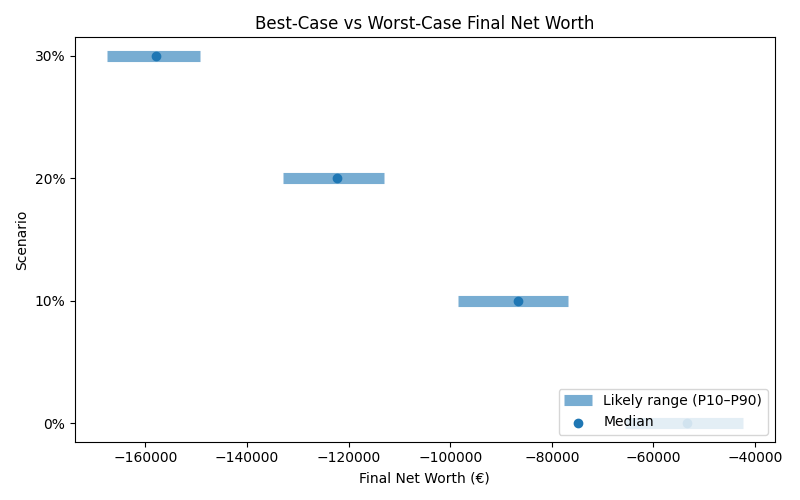
Results are shown as a realistic range. P10 represents a pessimistic outcome, while P90 represents an optimistic outcome. Most simulations fall between these two values.
| Scenario | Median Net Worth | P10 Net Worth | P90 Net Worth | FI Probability | FI Median Age |
|---|---|---|---|---|---|
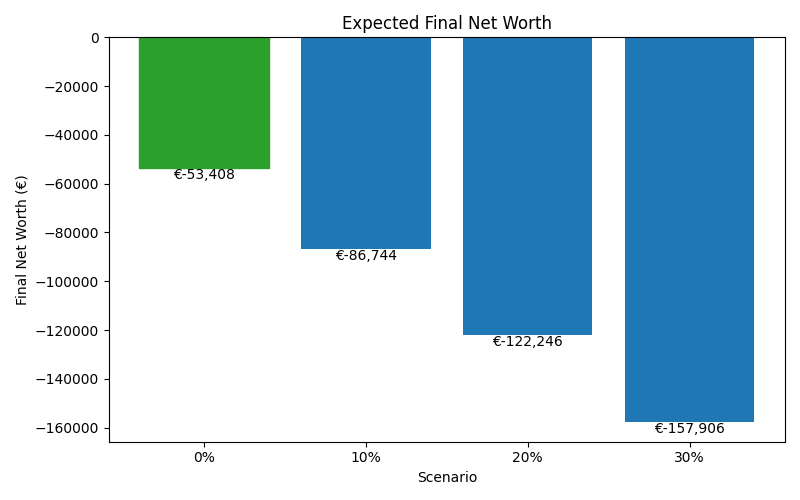
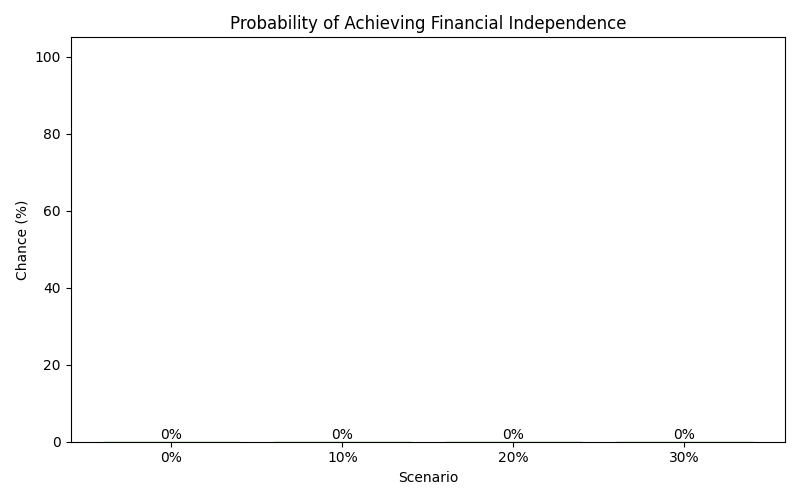
| 0% | -53,408 | -65,701 | -42,435 | 0% | — |
| 10% | -86,744 | -98,391 | -76,761 | 0% | — |
| 20% | -122,246 | -132,917 | -112,982 | 0% | — |
| 30% | -157,906 | -167,598 | -149,203 | 0% | — |
These charts show how each scenario affects long-term outcomes, including expected wealth, downside risk, and the likelihood of achieving financial independence.