Varied parameter
Income tax rate
0% → 30%
Retail worker in Munich · The steady builder
This page compares financial outcomes for a Retail worker living in Munich, Germany, following the The steady builder life scenario.
A balanced financial life built on predictable income growth, consistent saving, and long-term market participation. Progress comes from patience, stability, and compounding over time.
Munich offers very strong income potential in high-skill sectors, along with some of the highest living costs in Germany.
The comparison focuses on how changing the Income tax rate influences long-term results, while all other assumptions remain constant.
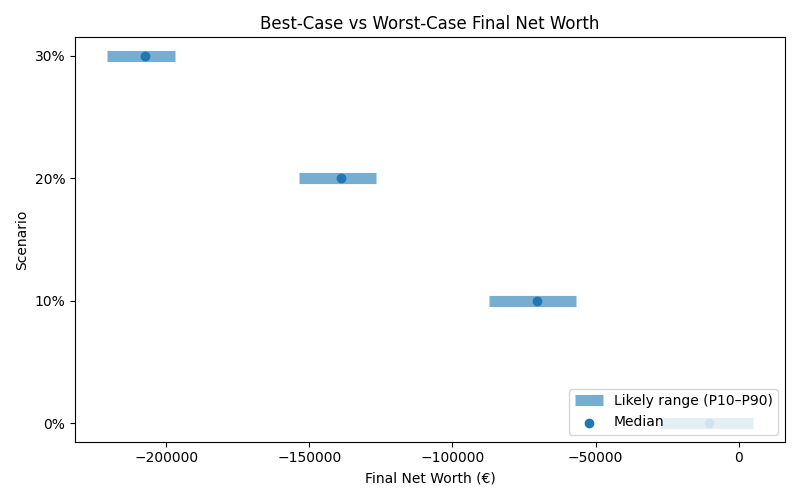
Results are shown as a realistic range. P10 represents a pessimistic outcome, while P90 represents an optimistic outcome. Most simulations fall between these two values.
| Scenario | Median Net Worth | P10 Net Worth | P90 Net Worth | FI Probability | FI Median Age |
|---|---|---|---|---|---|
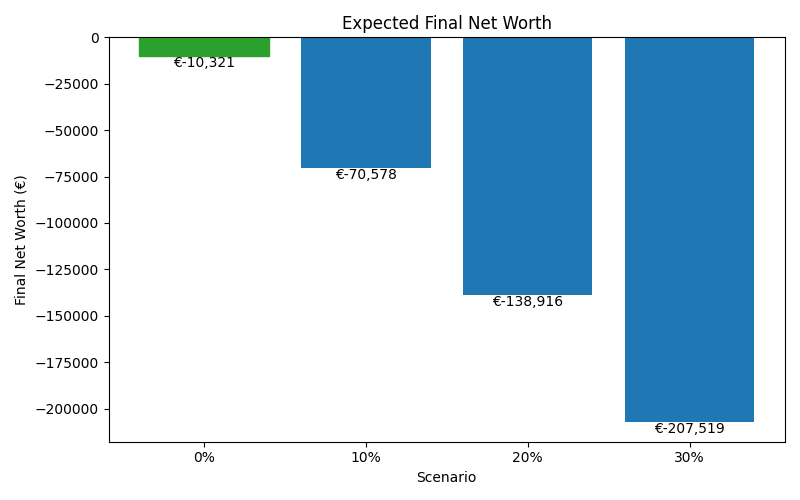
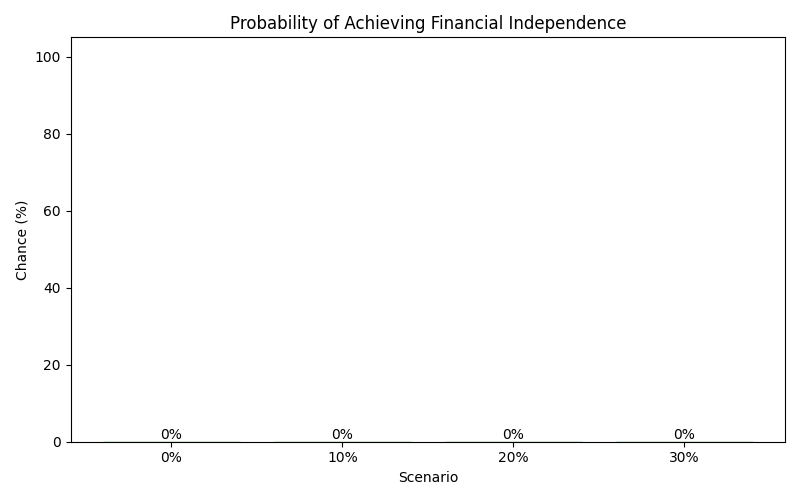
| 0% | -10,321 | -27,665 | 4,901 | 0% | — |
| 10% | -70,578 | -87,225 | -57,003 | 0% | — |
| 20% | -138,916 | -153,687 | -126,882 | 0% | — |
| 30% | -207,519 | -220,593 | -197,084 | 0% | — |
These charts show how each scenario affects long-term outcomes, including expected wealth, downside risk, and the likelihood of achieving financial independence.