Varied parameter
Income tax rate
0% → 30%
Retail worker in Munich · Health-related setbacks
This page compares financial outcomes for a Retail worker living in Munich, Germany, following the Health-related setbacks life scenario.
A life path influenced by recurring health-related financial strain. Even moderate disruptions, when repeated, can materially change long-term financial outcomes.
Munich offers very strong income potential in high-skill sectors, along with some of the highest living costs in Germany.
The comparison focuses on how changing the Income tax rate influences long-term results, while all other assumptions remain constant.
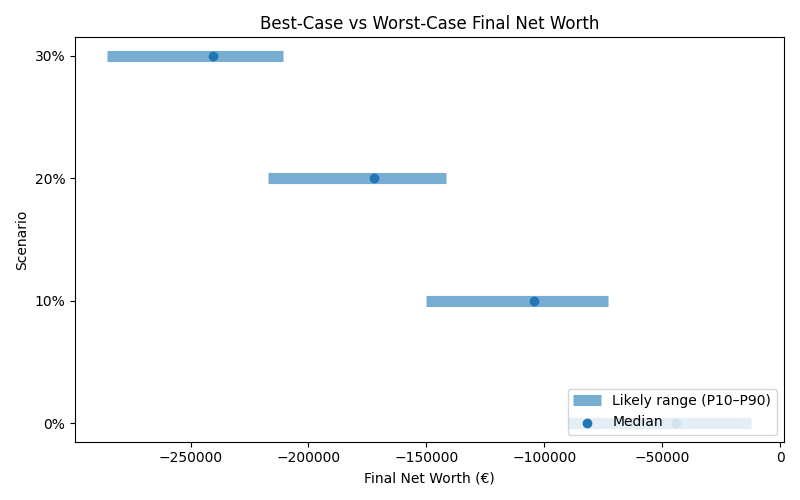
Results are shown as a realistic range. P10 represents a pessimistic outcome, while P90 represents an optimistic outcome. Most simulations fall between these two values.
| Scenario | Median Net Worth | P10 Net Worth | P90 Net Worth | FI Probability | FI Median Age |
|---|---|---|---|---|---|
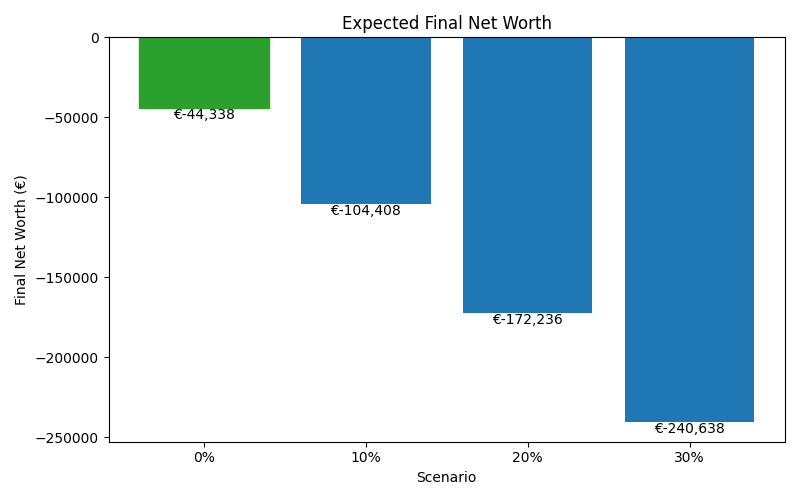
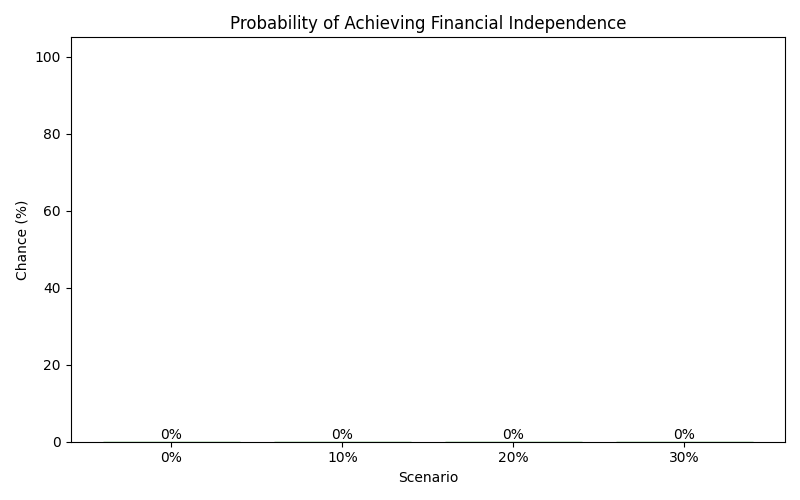
| 0% | -44,338 | -89,826 | -12,253 | 0% | — |
| 10% | -104,408 | -150,077 | -72,955 | 0% | — |
| 20% | -172,236 | -217,130 | -141,853 | 0% | — |
| 30% | -240,638 | -285,310 | -210,803 | 0% | — |
These charts show how each scenario affects long-term outcomes, including expected wealth, downside risk, and the likelihood of achieving financial independence.