Varied parameter
Income tax rate
0% → 30%
Retail worker in Munich · Family-first life
This page compares financial outcomes for a Retail worker living in Munich, Germany, following the Family-first life life scenario.
A financial path shaped by long-term household responsibilities and shared priorities. Progress trades flexibility for stability, planning, and collective decision-making.
Munich offers very strong income potential in high-skill sectors, along with some of the highest living costs in Germany.
The comparison focuses on how changing the Income tax rate influences long-term results, while all other assumptions remain constant.
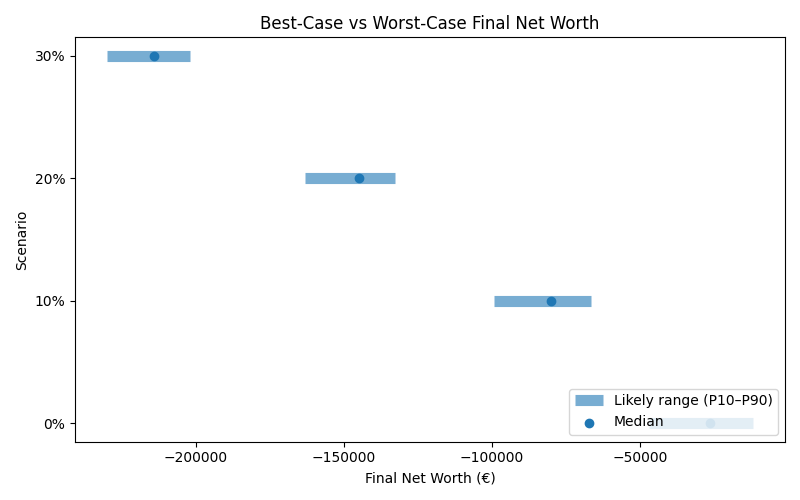
Results are shown as a realistic range. P10 represents a pessimistic outcome, while P90 represents an optimistic outcome. Most simulations fall between these two values.
| Scenario | Median Net Worth | P10 Net Worth | P90 Net Worth | FI Probability | FI Median Age |
|---|---|---|---|---|---|
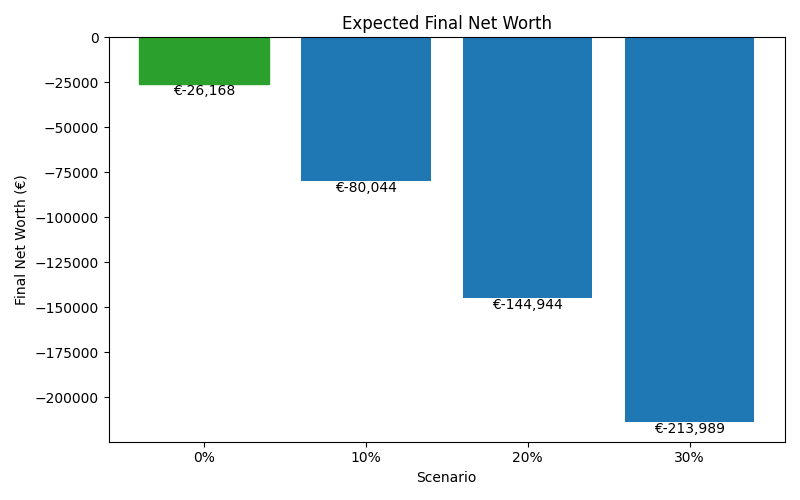
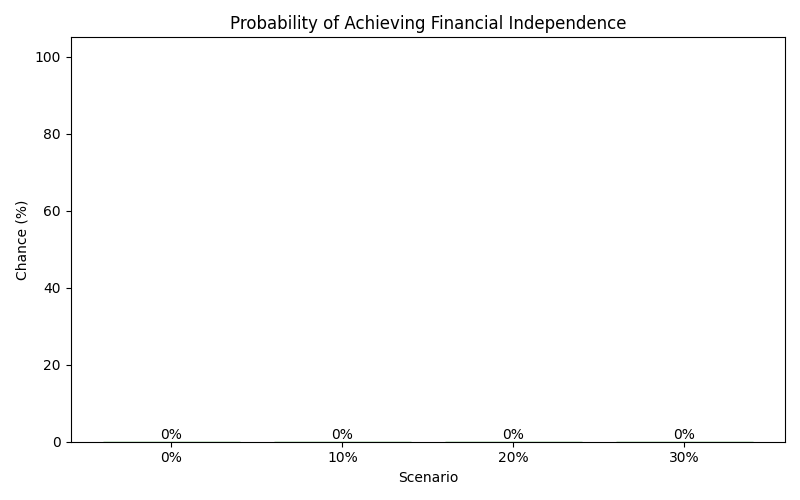
| 0% | -26,168 | -47,064 | -11,893 | 0% | — |
| 10% | -80,044 | -99,295 | -66,482 | 0% | — |
| 20% | -144,944 | -163,192 | -132,734 | 0% | — |
| 30% | -213,989 | -229,874 | -201,999 | 0% | — |
These charts show how each scenario affects long-term outcomes, including expected wealth, downside risk, and the likelihood of achieving financial independence.