Varied parameter
Income tax rate
0% → 30%
Retail worker in Hamburg · The steady builder
This page compares financial outcomes for a Retail worker living in Hamburg, Germany, following the The steady builder life scenario.
A balanced financial life built on predictable income growth, consistent saving, and long-term market participation. Progress comes from patience, stability, and compounding over time.
Hamburg has a strong professional services and logistics economy, with above-average costs and solid income potential.
The comparison focuses on how changing the Income tax rate influences long-term results, while all other assumptions remain constant.
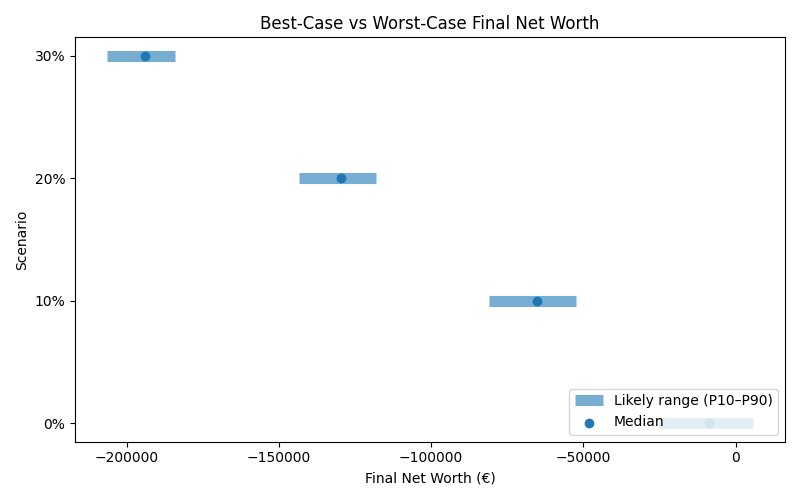
Results are shown as a realistic range. P10 represents a pessimistic outcome, while P90 represents an optimistic outcome. Most simulations fall between these two values.
| Scenario | Median Net Worth | P10 Net Worth | P90 Net Worth | FI Probability | FI Median Age |
|---|---|---|---|---|---|
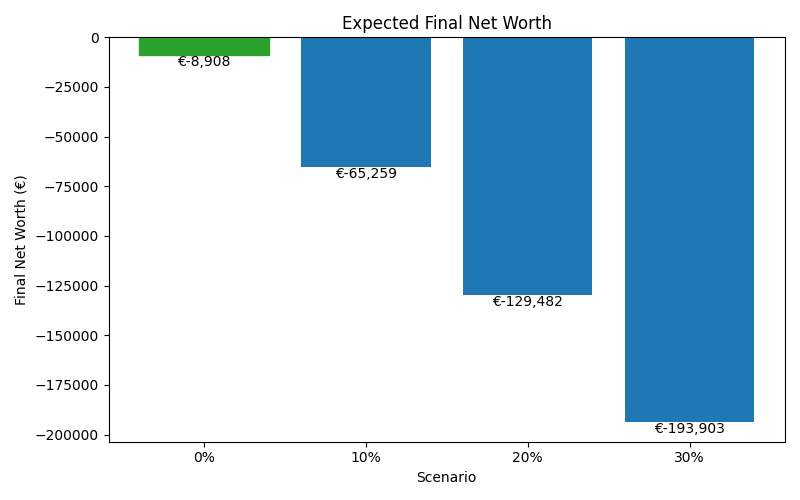
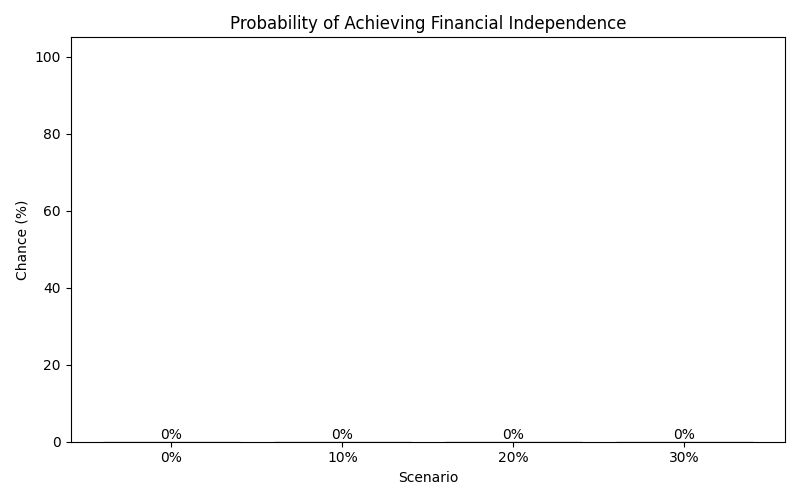
| 0% | -8,908 | -25,088 | 5,605 | 0% | — |
| 10% | -65,259 | -80,865 | -52,508 | 0% | — |
| 20% | -129,482 | -143,471 | -118,198 | 0% | — |
| 30% | -193,903 | -206,351 | -184,236 | 0% | — |
These charts show how each scenario affects long-term outcomes, including expected wealth, downside risk, and the likelihood of achieving financial independence.