Varied parameter
Saving rate
5% → 25%
Retail worker in Hamburg · Living on thin margins
This page compares financial outcomes for a Retail worker living in Hamburg, Germany, following the Living on thin margins life scenario.
A financial path with limited room for error, where small shocks can have outsized effects. Long-term outcomes depend more on resilience, adaptability, and avoiding major setbacks.
Hamburg has a strong professional services and logistics economy, with above-average costs and solid income potential.
The comparison focuses on how changing the Saving rate influences long-term results, while all other assumptions remain constant.
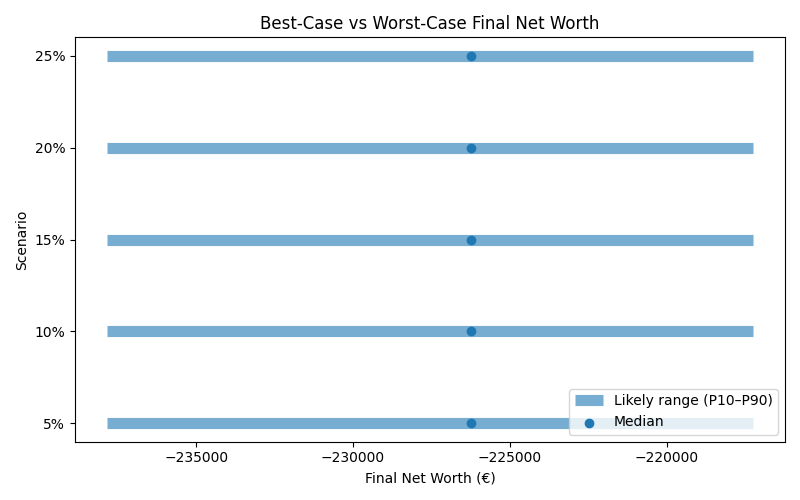
Results are shown as a realistic range. P10 represents a pessimistic outcome, while P90 represents an optimistic outcome. Most simulations fall between these two values.
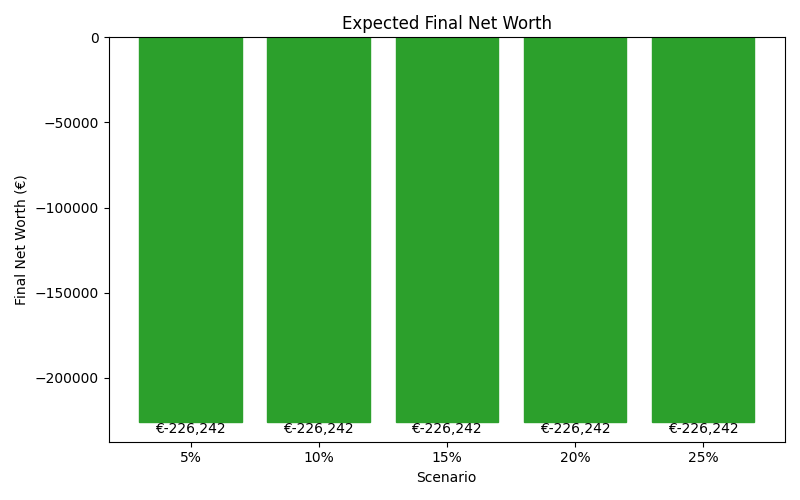
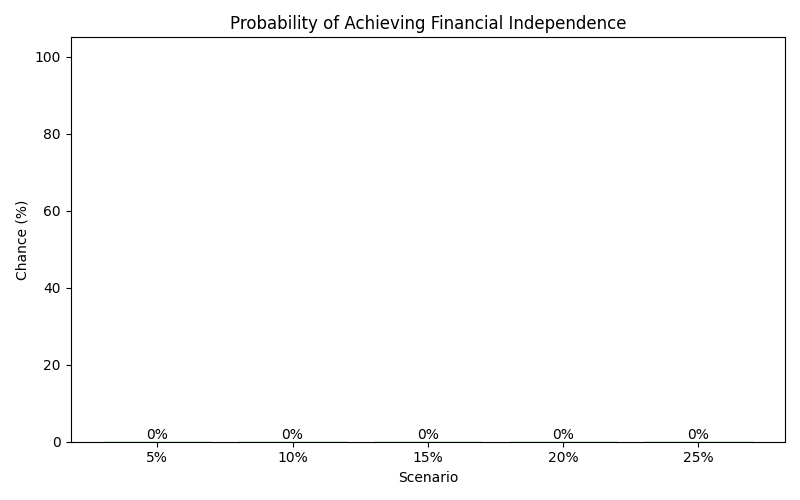
| Scenario | Median Net Worth | P10 Net Worth | P90 Net Worth | FI Probability | FI Median Age |
|---|---|---|---|---|---|
| 5% | -226,242 | -237,838 | -217,255 | 0% | — |
| 10% | -226,242 | -237,838 | -217,255 | 0% | — |
| 15% | -226,242 | -237,838 | -217,255 | 0% | — |
| 20% | -226,242 | -237,838 | -217,255 | 0% | — |
| 25% | -226,242 | -237,838 | -217,255 | 0% | — |
These charts show how each scenario affects long-term outcomes, including expected wealth, downside risk, and the likelihood of achieving financial independence.