Varied parameter
Income tax rate
0% → 30%
Retail worker in Hamburg · Health-related setbacks
This page compares financial outcomes for a Retail worker living in Hamburg, Germany, following the Health-related setbacks life scenario.
A life path influenced by recurring health-related financial strain. Even moderate disruptions, when repeated, can materially change long-term financial outcomes.
Hamburg has a strong professional services and logistics economy, with above-average costs and solid income potential.
The comparison focuses on how changing the Income tax rate influences long-term results, while all other assumptions remain constant.
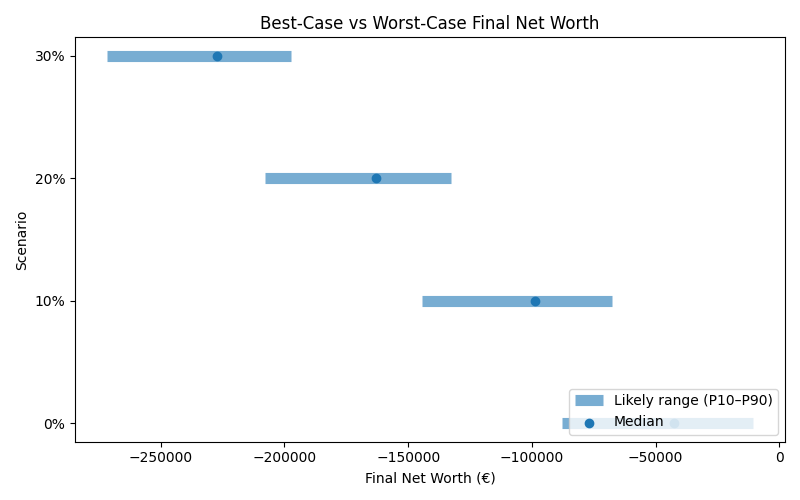
Results are shown as a realistic range. P10 represents a pessimistic outcome, while P90 represents an optimistic outcome. Most simulations fall between these two values.
| Scenario | Median Net Worth | P10 Net Worth | P90 Net Worth | FI Probability | FI Median Age |
|---|---|---|---|---|---|
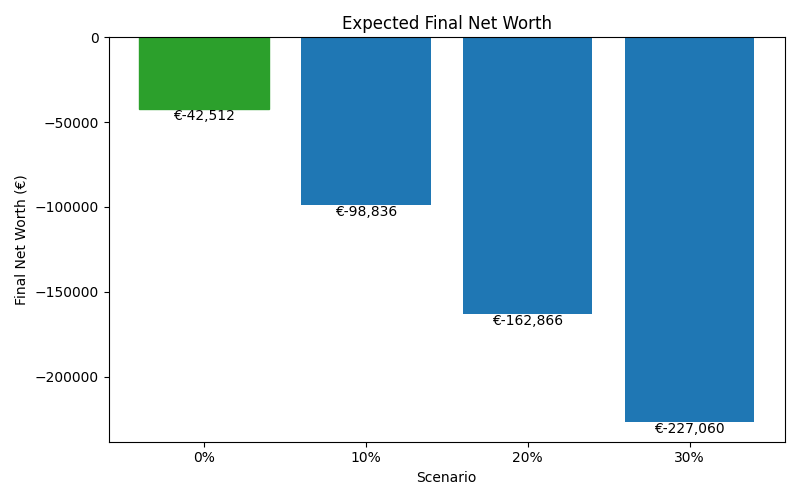
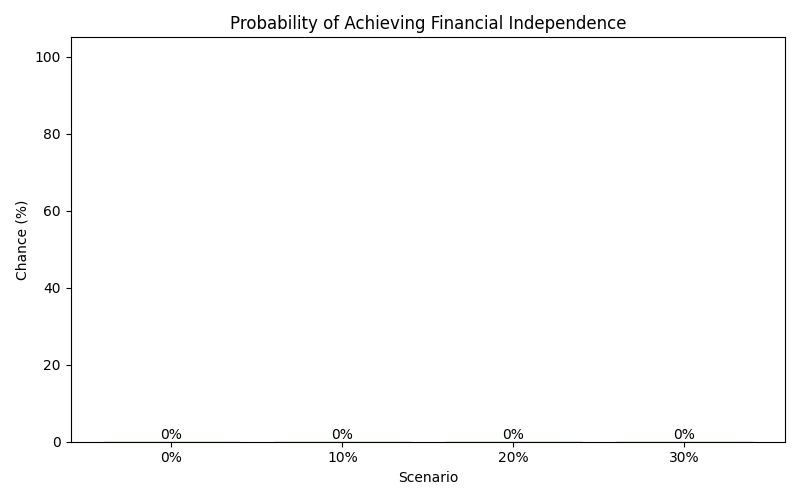
| 0% | -42,512 | -87,798 | -10,804 | 0% | — |
| 10% | -98,836 | -144,401 | -67,843 | 0% | — |
| 20% | -162,866 | -207,678 | -132,519 | 0% | — |
| 30% | -227,060 | -271,538 | -197,371 | 0% | — |
These charts show how each scenario affects long-term outcomes, including expected wealth, downside risk, and the likelihood of achieving financial independence.