Varied parameter
Investment return (expected)
3% → 7%
Retail worker in Berlin · Health-related setbacks
This page compares financial outcomes for a Retail worker living in Berlin, Germany, following the Health-related setbacks life scenario.
A life path influenced by recurring health-related financial strain. Even moderate disruptions, when repeated, can materially change long-term financial outcomes.
Berlin has a diverse economy with strong demand in technology and services, paired with a relatively high cost of living.
The comparison focuses on how changing the Investment return (expected) influences long-term results, while all other assumptions remain constant.
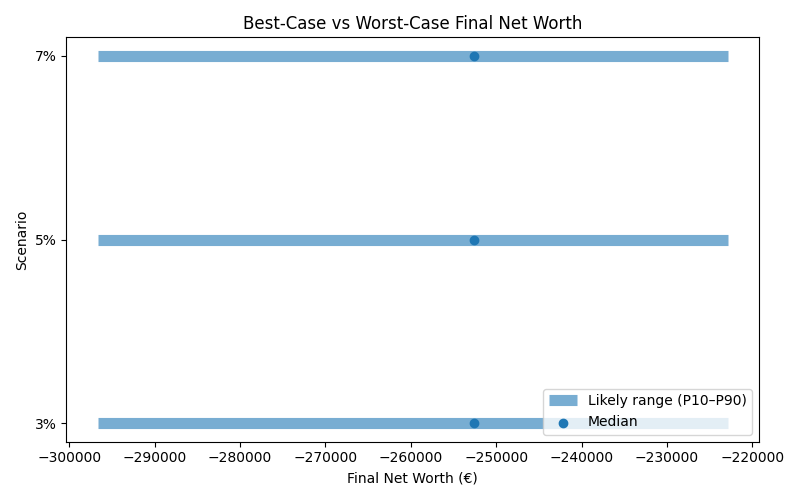
Results are shown as a realistic range. P10 represents a pessimistic outcome, while P90 represents an optimistic outcome. Most simulations fall between these two values.
| Scenario | Median Net Worth | P10 Net Worth | P90 Net Worth | FI Probability | FI Median Age |
|---|---|---|---|---|---|
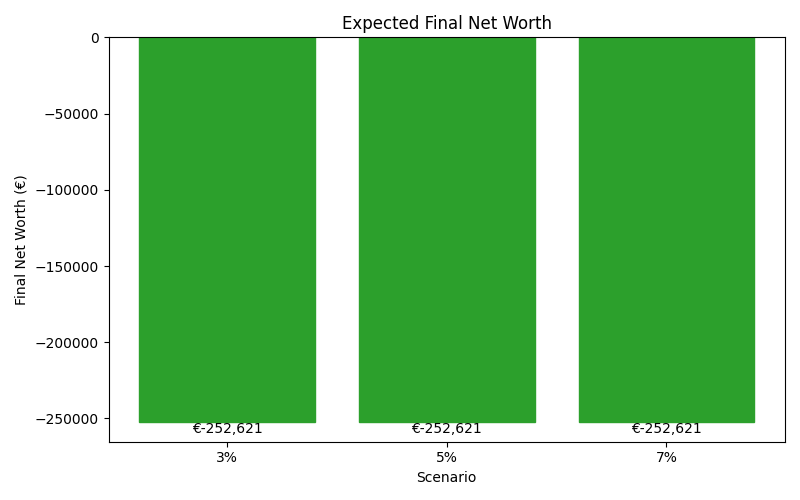
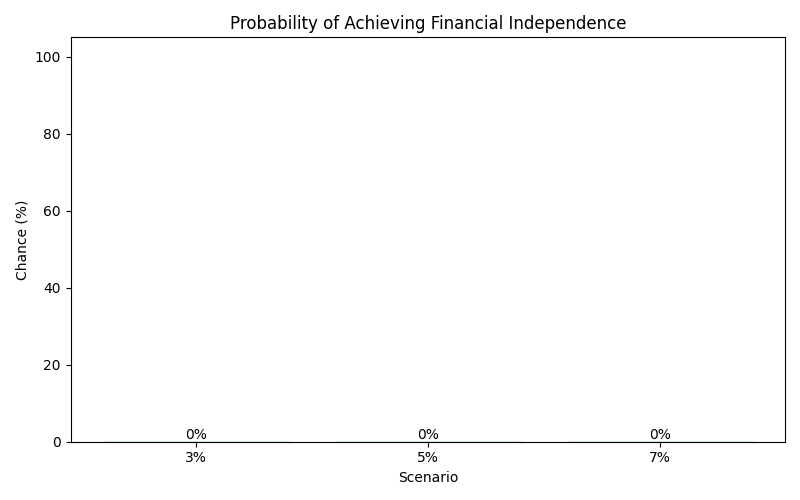
| 3% | -252,621 | -296,698 | -222,891 | 0% | — |
| 5% | -252,621 | -296,698 | -222,891 | 0% | — |
| 7% | -252,621 | -296,698 | -222,891 | 0% | — |
These charts show how each scenario affects long-term outcomes, including expected wealth, downside risk, and the likelihood of achieving financial independence.